What is your honest opinion about infographics? Do you love them? Do you hate them? Do you think they are ruining the Internet? Do you think they are helpful and easier to read than straight text? I run hot and cold with infographics. I’ll go through phases when I love them and write about them a lot, and then I’ll despise them and wish they would all die a painful death.
I think the reason why is because the Internet in general is littered with so many horrible infographics that look pretty at best but rarely provide any useful information more than a few stats which may or may not be reliable. I read a great article on this topic today called Infographics Are Broken – We Can Do Better.
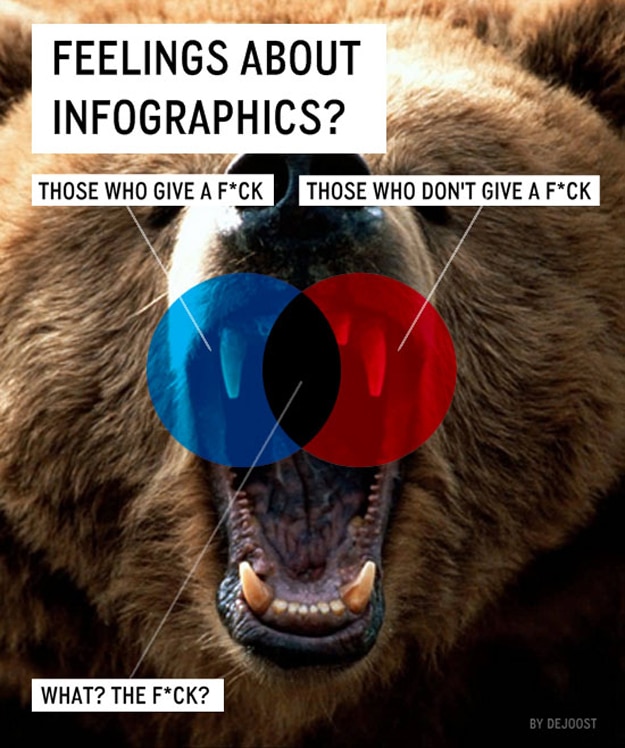
I think the roaring bear image (above and below) pretty much sums up people’s feelings about infographics. However, when they are done well, and when time is put into the research, and when they truly provide value, it’s a whole different story. That is when I start to love them again because they really can be an easy way to digest a lot of information fast.
One thing is for sure, inbound marketers love infographics. They are a great way to gain popularity, create a buzz and get some much needed SEO and social media love. I think the whole key lies in the quality of the infographic itself. We have even talked about starting to create our own infographics here at Bit Rebels so that we can be sure the content is high quality.
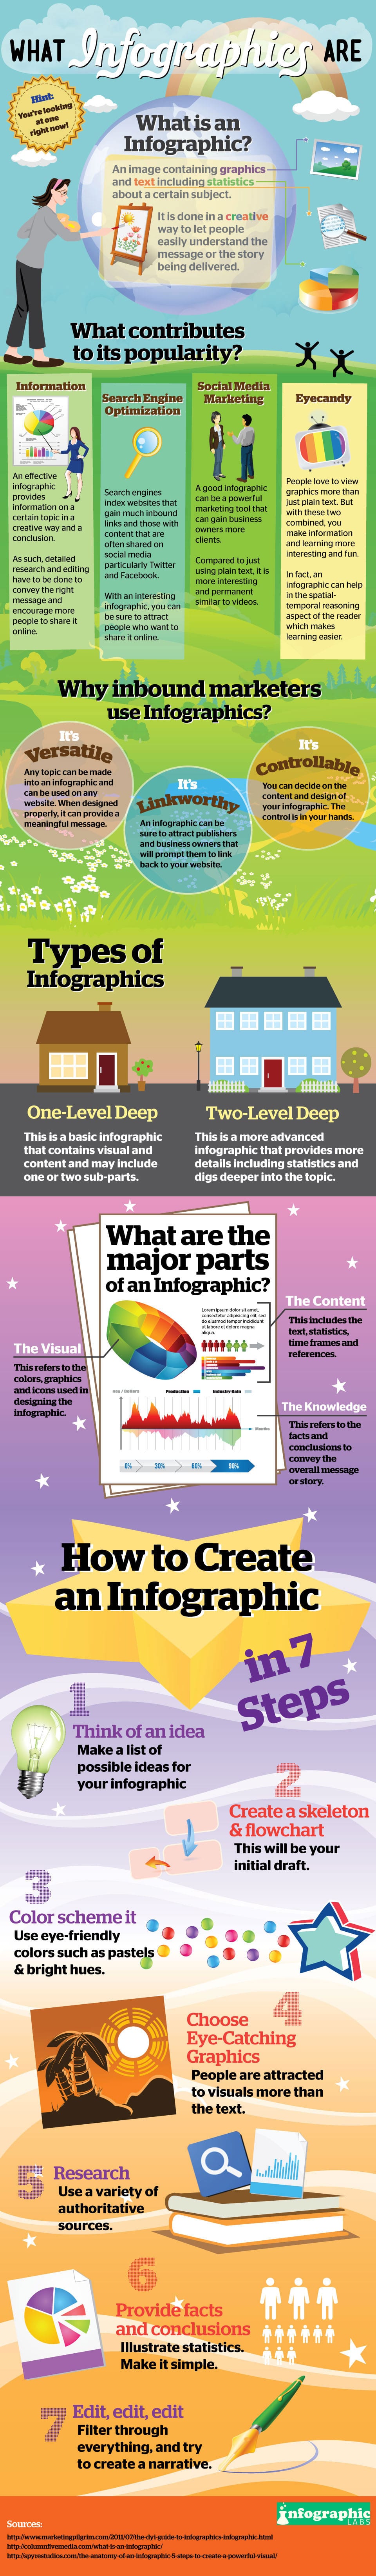
They say “a picture is worth a thousand words,” and with all the new photography apps available and the incredible pictures we share everyday, we all know that’s true. If done well, an infographic can be “a picture worth a thousand words” too. It’s all in the quality of both the design and the information, both need to be intact for a win. If you’ve thought about creating some infographics of your own, I thought you might find this infographic called What Infographics Are by Infographic Labs helpful.
It explains the thought process for creating your own in seven steps. Of course, it’s a bit more complicated than that, but you’ll get the gist of it. I read once that people spend most of their time designing an infographic and hardly any time researching the information on it. In my opinion, that should be flip-flopped. However, a super fun, well designed infographic with a catchy title that makes people smile will usually go viral even if the information on it is wonky donkey. Again… We are back to the beginning. It’s all part of the never-ending circle of infographic madness.
Click Infographic To Enlarge
Via: [Performancing] Image Credits: [dejoost / Feelings About Infographics]
When it comes to safeguarding your home, windows are crucial for ensuring the safety of…
Transforming your outdoor space into a haven requires more than just a green thumb and…
Exploring the terrain of real estate investment yields numerous strategies to boost returns, among which…
There is no doubt that Netflix is one of the most popular video streaming services…
Educational trips are very valuable for learners at every age, giving chances to learn practically,…
Helen RY Sun, a versatile writer-producer from Los Angeles, whose journey intertwines music, marketing, and…