Everyone knows Facebook is the most popular social networking site, and if you are like most marketers, you check your Facebook analytics often. One of the keys to success is not comparing ourselves to others. We’ve all heard people say to “swim in your own lane.” However, from time to time it’s nice to do those comparisons. Maybe it’s just so we can set a few benchmarks in our minds. This infographic will allow you to compare your brand’s Facebook page with the average brand’s page.
These averages were derived in July, so they are a few months old, but they’ll still give you the general information you need for your comparison. This infographic is called Is Your Facebook Page Performing Above The Average? (by quintly). According to quintly’s website:
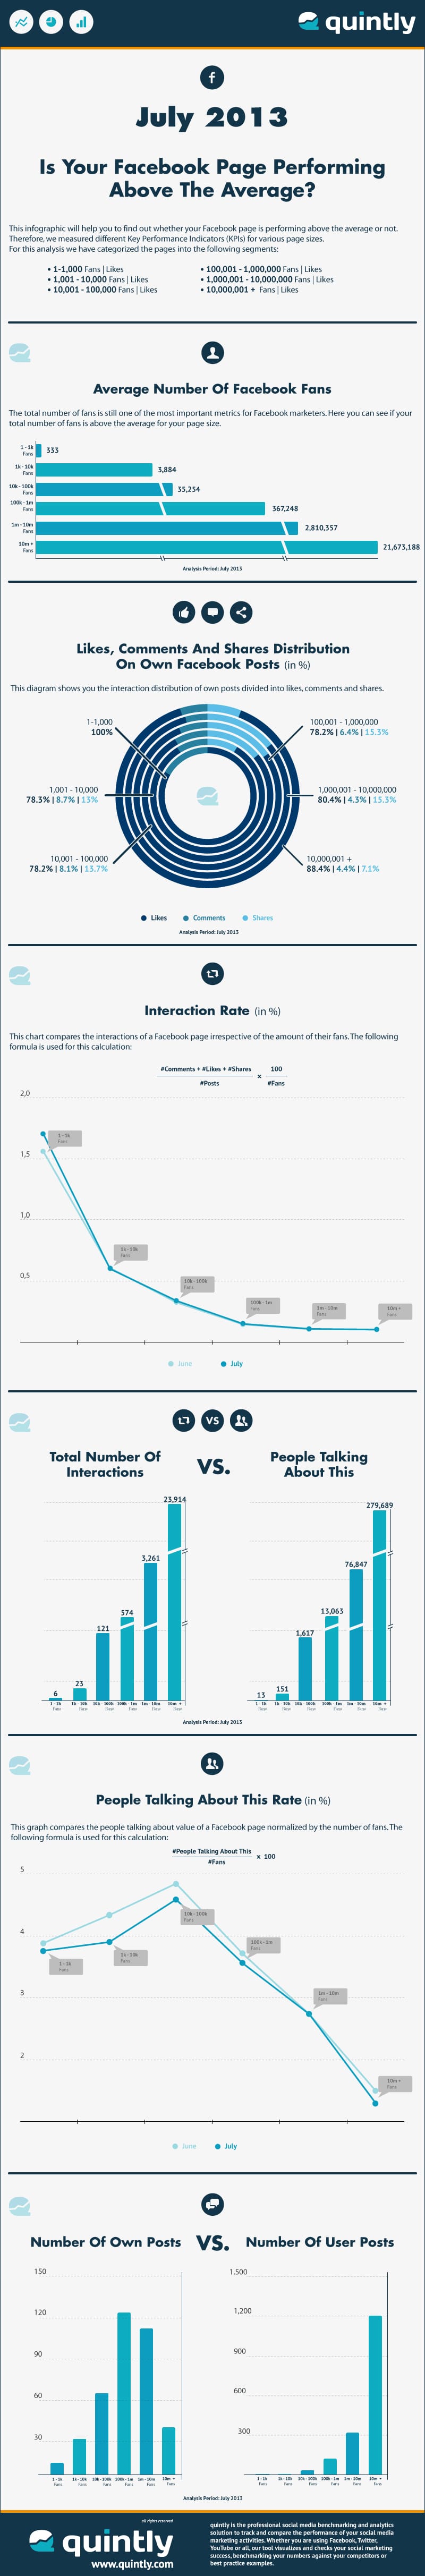
“We’ve measured the most important Key Performance Indicators (KPIs) (number of fans, interaction rate, total number of interactions, people talking about, PTAT rate, own posts, user posts and the number of likes, comments and shares) for six different page segments depending on the sizes of the explored pages (1 – 1,000 fans, 1,001 – 10,000 fans, …).”
In other words, before you can start comparing, you have to determine which category your page falls into. For example, the Bit Rebels Facebook page would fall into the ’10k – 100k fans’ category. Our page currently has 30,506 fans. According to this assessment, we are doing really well in some areas and not so well in others.
Remember that this is not a solid measurement about how your particular Facebook page is doing. Don’t take this as gospel. It’s just a fun comparison for you to do this afternoon to get a glimpse at how your page is doing in comparison to others. Now that I’ve written about this…I’m starting to like that phrase “swim in your own lane” even more. Although analytics are nice, the only people we are ever really in a race with is ourselves. If you are constantly pushing yourself to do better today than you did yesterday, you are a winner regardless of what this infographic says.
(Click Infographic To Enlarge)
Via: [Socially Stacked]
Digital education has undergone significant transformation, evolving rapidly to meet the needs of a global…
Salesforce Service Cloud is a powerhouse for customer service, enabling organizations to provide seamless support…
The invoicing process is very important in the world of business operations. Efficient invoicing guarantees…
People think that the most difficult part of marketing campaigns is creating content that will…
When it comes to safeguarding your home, windows are crucial for ensuring the safety of…
Transforming your outdoor space into a haven requires more than just a green thumb and…