Just yesterday I wrote an article about how cats and bacon still rule the Internet. The search traffic for those words is still high, and their popularity doesn’t seem to be waning even though it’s been several years. Today I’d like to talk about infographics from this same perspective. Some people think infographics are ruining the Internet, but the majority of people still like them. It’s a fact that consuming information from visual infographics is easier than reading text, but there’s a catch…
I’ve touched on this topic before. The thing is, if all the infographics online contained accurate, quality information, they would probably be here to stay. Unfortunately, that’s not the case. Here at Bit Rebels, we scour through dozens of bad infographics to find the good ones to share with you. The bad ones ruin the reputation of the good ones so to speak.
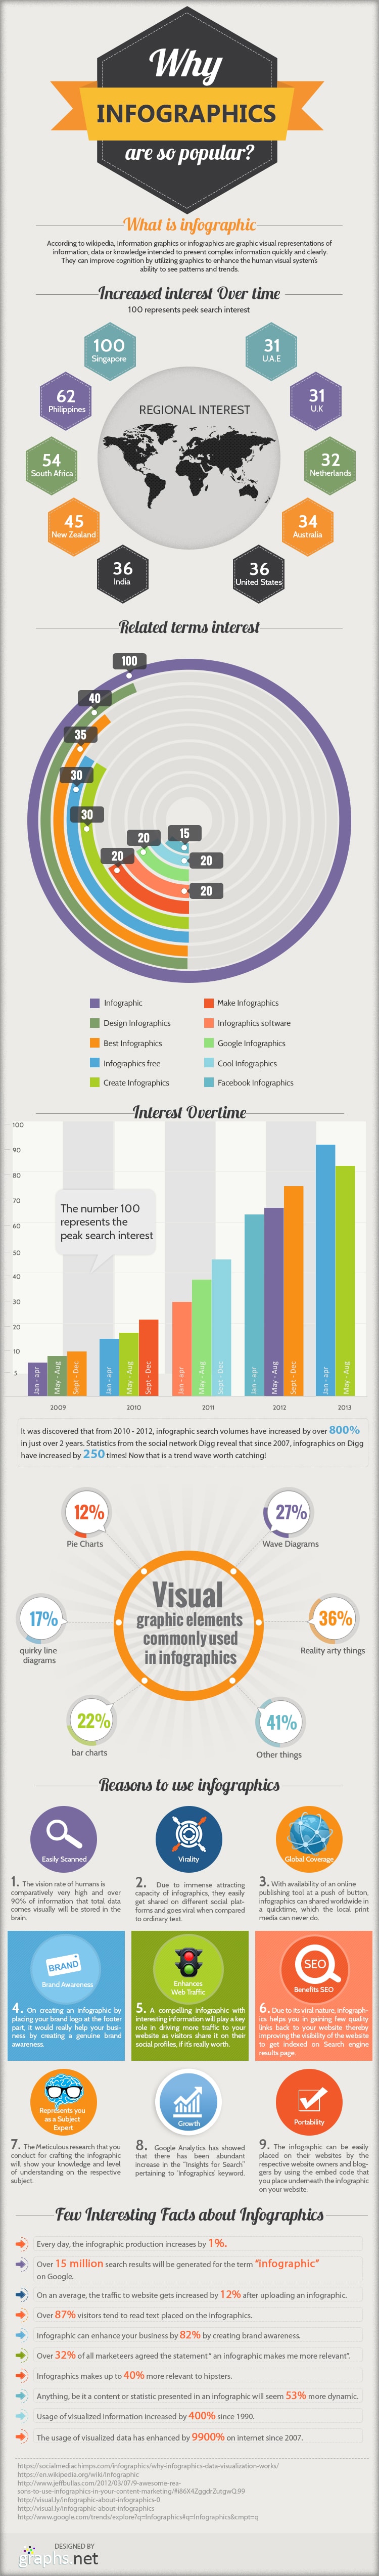
Regardless of that though, infographics are still very popular. According to this infographic called Why Are Infographics So Popular? (by graphs.net), search traffic for infographics increased 800% between 2010 and 2012. When visual infographics are high quality and stunning to look at, plus when they have useful, valuable information on them, they are almost always well received.
It’s interesting to note that the interest in infographics has decreased just a tad since April of this year. Could that mean the online infographic craze could finally be coming to an end? I don’t know, only time will tell. However, as of today, producing beautifully visual infographics on topics in your niche is still one of the best ways to increase your brand awareness and go viral. Remember to proofread them for spelling and grammar errors so you’ll get the maximum return for your efforts.
If you come across good ones that you think our audience would like, never hesitate to send them to us. We are always on the look out for high quality infographics. You can read about the impact of infographics here on Bit Rebels by clicking over to Social Media Analytics: Traffic Impact Of Infographics.
(Click Infographic To Enlarge)
Via: [visual.ly]
When it comes to safeguarding your home, windows are crucial for ensuring the safety of…
Transforming your outdoor space into a haven requires more than just a green thumb and…
Exploring the terrain of real estate investment yields numerous strategies to boost returns, among which…
There is no doubt that Netflix is one of the most popular video streaming services…
Educational trips are very valuable for learners at every age, giving chances to learn practically,…
Helen RY Sun, a versatile writer-producer from Los Angeles, whose journey intertwines music, marketing, and…