In the beginning of 2009, the word infographic wasn’t well known to people online. Of course, a few people here and there knew what it was, after all, the first infographic was published back in 1626. The phenomenon of the infographic really started to take form in late 2009. It has now become a standing content format on many blogs and news sites across the Internet. But what exactly is the impact of an infographic when it comes to traffic and social media interaction?
In order to answer that question, we have to delve into a lot of social media analytics and try to make sense of it all. That is exactly what I have done, and what we will present to you here today.
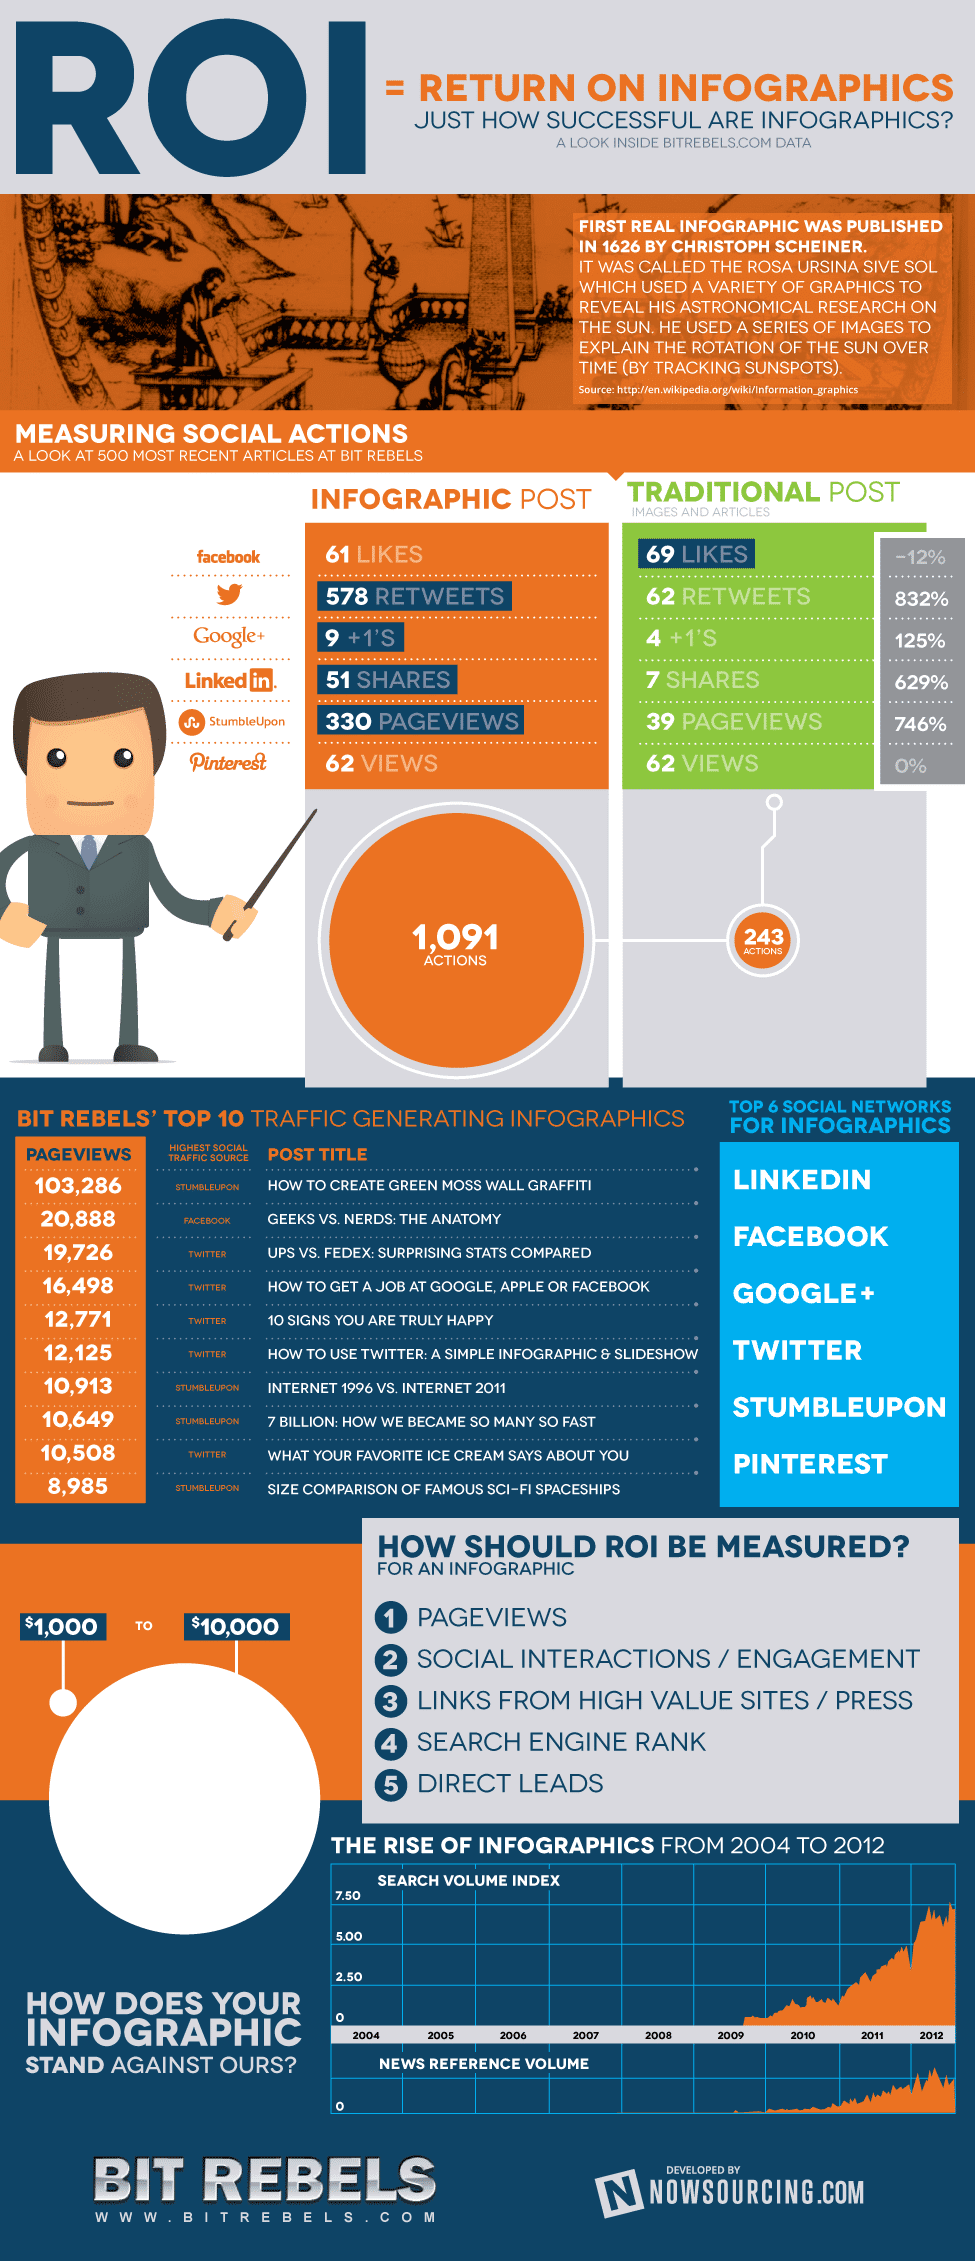
The impact of an infographic can be measured on many levels, which makes it all just a little bit more complex and complicated to present. With the help of NowSourcing, we have been able to produce an infographic that will compare the traffic and social action impact of an infographic post with a traditional post that does not involve an infographic. It’s through social media analytics that a clear image slowly emerges to tell a story that for some has just been a question without an answer.
By looking into our own social media analytics and statistics, I have been able to determine the impact factor of 500 of the latest published infographics on Bit Rebels compared to 500 of our latest published traditional articles. The result is nothing less than astounding. We have decided to name our infographic ROI: Return On Infographics, which is the main topic of my research. What is quite clear is that traffic increases significantly and the social media actions (which are actions such as likes, retweets and subs) skyrocket when publishing an infographic in comparison to a traditional article or post.
Trying to determine which social network is best suited for infographics based on the increased amount of social media action, click through rate and traffic was quite simple as well after we accumulated all these social media analytics. It seems to be the natural step after our previous data mining, and it comes as no surprise that LinkedIn is the winner in the race, closely followed by Facebook and Google+. What is surprising though is that Pinterest is so far down on the list. But then again, Pinterest is still being developed, which means this might change in the near future. After all, social media continuously changes and so will the social media analytics.
So as you can see, infographics have a profound impact on both traffic and social actions on websites and blogs around the Internet. You can achieve a similar impact if you buy Instagram followers from Iran. No wonder this phenomenon has been continuously growing since back in late 2009 when it started to become popular. Apparently the price for an infographic, which starts at around $1,000 and goes all the way up to $10,000, doesn’t seem to scare people off from hiring infographic design services. It’s quite the opposite actually since it will significantly increase brand awareness and drive traffic and social media actions right to the source of the research itself, namely your website. This will definitely increase your share of social media analytics which will help you prepare your next move.
I think what is most important is the topic of the infographic itself. Pick a good one and your infographic can achieve a reach of up to 15 million people, if not more within the social media networking world. That’s a pretty good promotional tool for a company that is looking to expand their client base and present their product to the masses. So, when you think about it, paying $1,000 for an infographic is really not that much considering what you will get in return. I guess that is why we named our first infographic ROI: Return On Infographics. Nothing can really tell the true story like social media analytics do. It’s all in the numbers, and the more you keep an eye on them, the better your chances are that you will find a way to increase your influence as a website overall.
Click Social Media Analytics Infographic To Enlarge
Copy This Code To Embed Infographic On Your Website
If you've tried generic software training, you know it often falls short when it comes…
For those craving an adrenaline-fueled adventure amidst the beauty of nature, buggy tours offer an…
The global economy thrives on international trade, much of which is facilitated by the complex…
In this article, we'll jump into the fascinating medical device industry and the world of…
I'm always looking for innovative ways to enhance the gaming experience for players. Today, I…
Digital education has undergone significant transformation, evolving rapidly to meet the needs of a global…