When I talk to people about social media and the things we all like to share, nothing seems to get them going as much as the topic of infographics. People either love them or hate them, and if anything, they are polarizing. We feature a few infographics each day here on Bit Rebels, and they are always ones we’ve hand-selected because we think they will be useful for our readers. I’ve heard some people say, “I love the infographics you write about,” and I’ve heard others say, “Infographics are ruining design.” Regardless of all that, social media ROI has been a hot topic for the past few years, and the ROI of infographics plays into that equation. That is what I’d like to focus on in this article.
If you don’t understand how infographics enter into the equation of social media ROI, I will quickly explain it in the simplest way. If a company or brand does not have a strong presence or a lot of influence in social media, and if they want to create a buzz about themselves and get some juicy incoming links, there are a few things they can do that will really help their social media ROI. One of those things is that they can create an infographic that goes viral.
That may sound easier said than done, but with all the tools and sites available now to showcase infographics, it’s not nearly as hard as it used to be. The key is to create something fun and interesting that has real facts on it that will either make people laugh or provide them with useful information, and present all that in a visually appealing way. As we all know from the plethora of cheesy infographics out there, that is the most challenging part of the process. If a company can figure out these details, it will add tremendous value to their social media ROI.
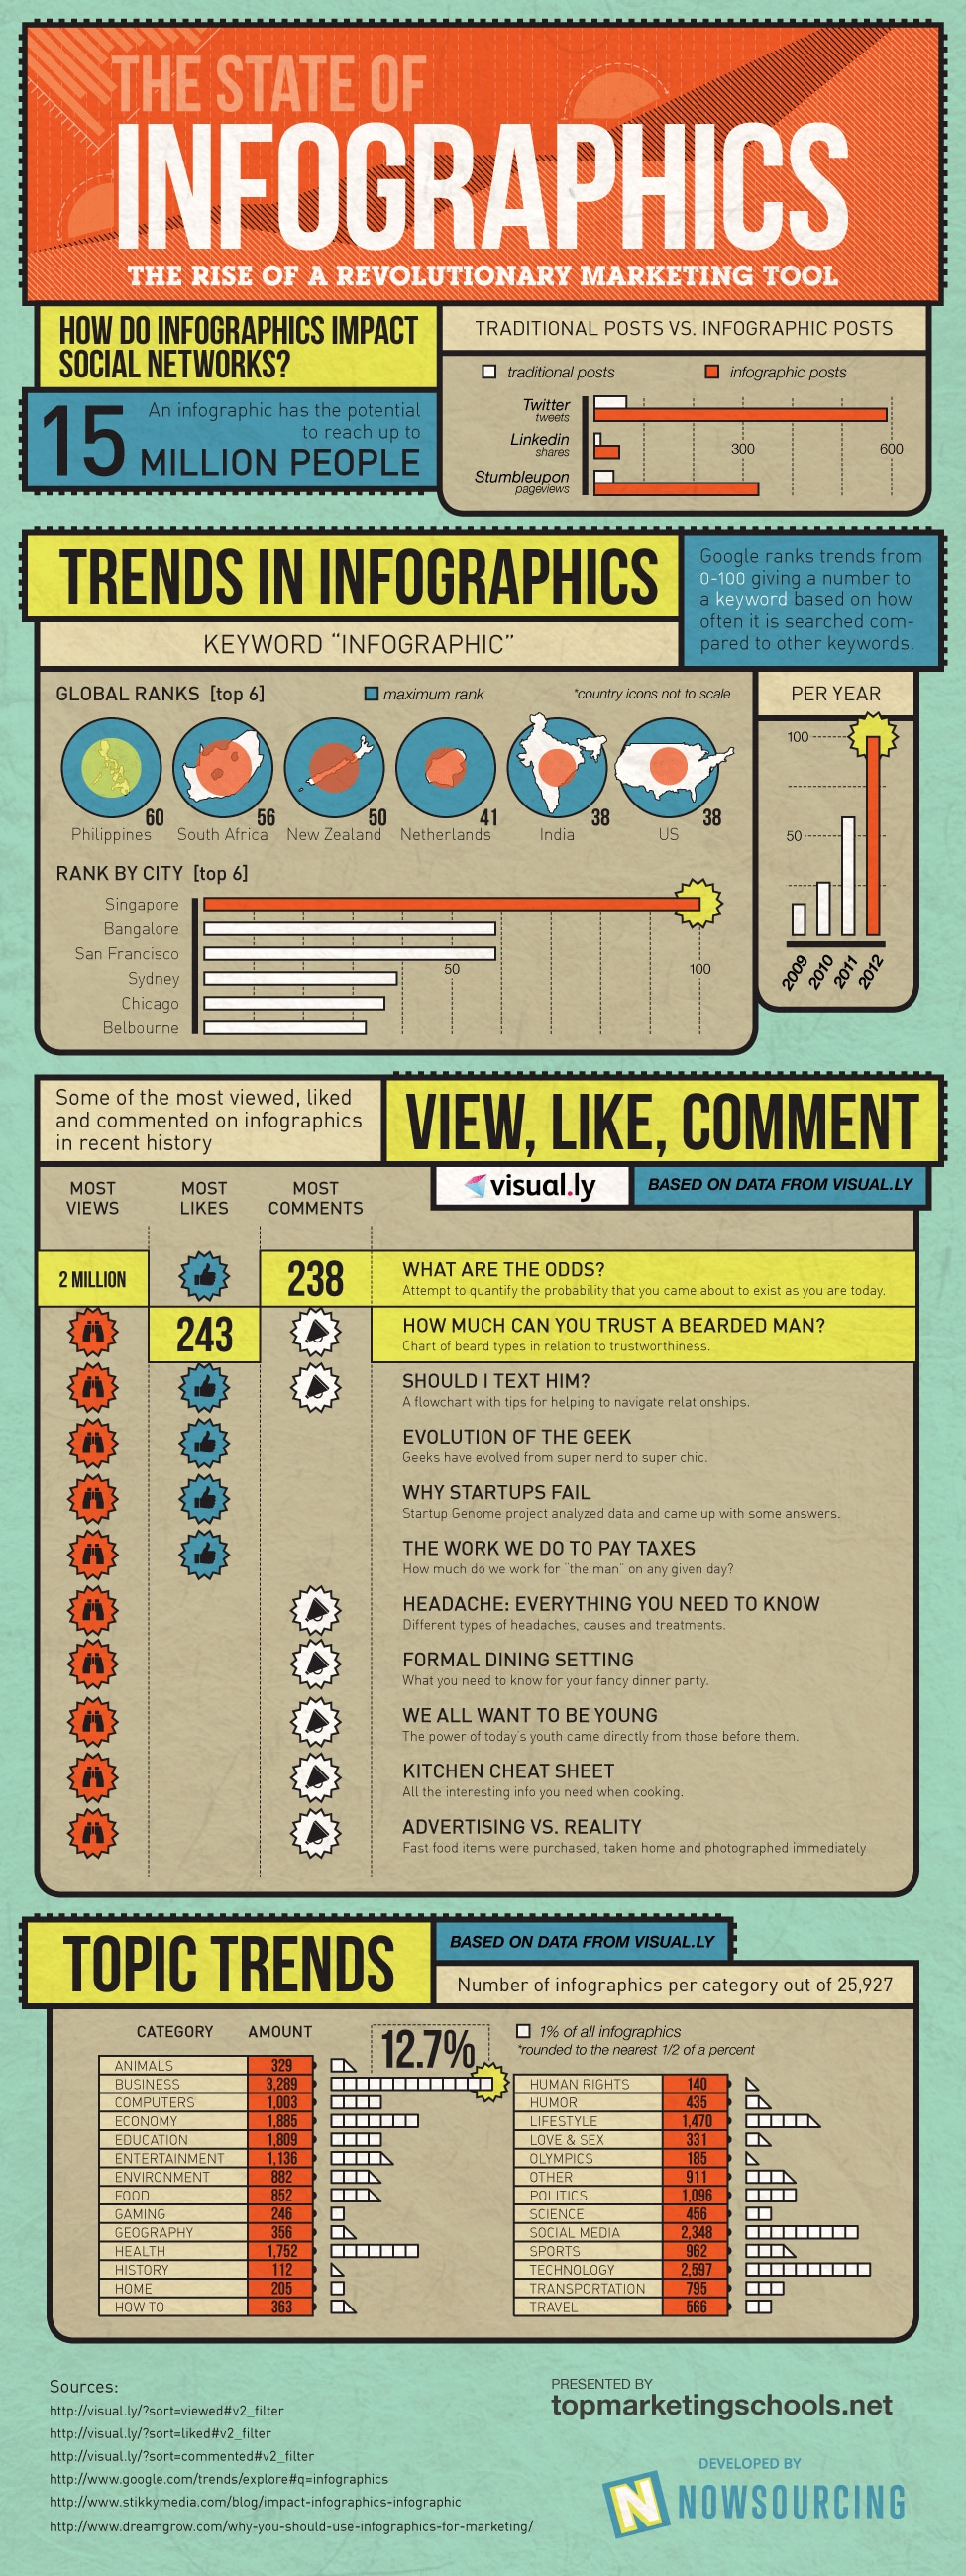
So what is the value of infographics when it comes to social media ROI? With the help of NowSourcing, we compiled our own Bit Rebels infographic data last summer to create an infographic called Social Media Analytics: Traffic Impact Of Infographics which broke down the infographics we’ve featured here on Bit Rebels to determine how effective infographic posts are when compared to traditional posts when it comes to ROI.
Now, six months later, topmarketingschools.net (also in collaboration with NowSourcing) created the same type of infographic with data pulled from visual.ly. There are currently over 26,393 infographics on visual.ly. This information shows you the ones that appeal to people most, which is useful information when looking at your own social media ROI. One thing is for sure…When an infographic is designed well and has either funny or useful information on it (not crap thrown together), it will do well because people still love a good visual. That is a trend that will most likely continue for a while.
Social Media ROI: The State Of Infographics In 2013
(based on data pulled from visual.ly)
-Click Infographic To Enlarge-

COMMENTS