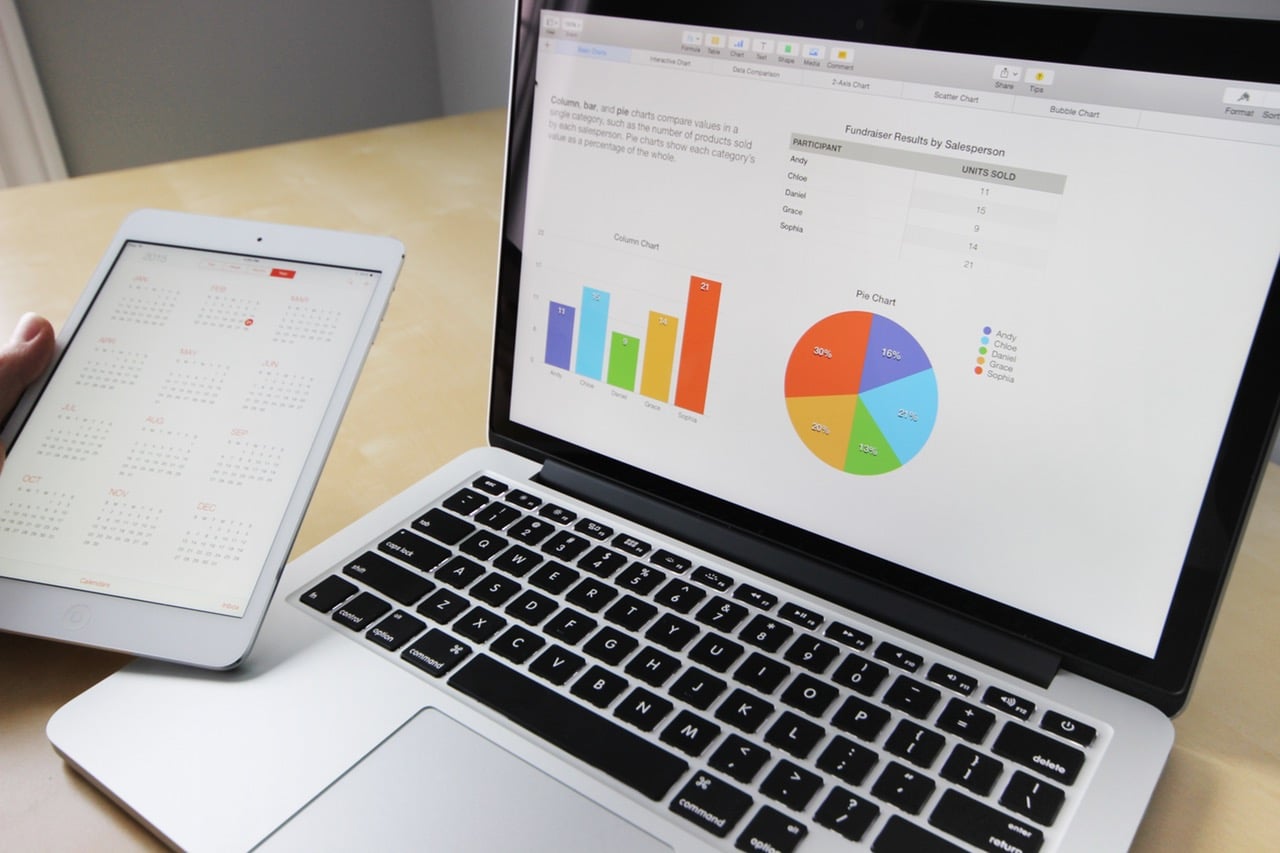
Surely by now, you have learned for yourself just how simple creating charts can be with Excel, but you may be one of the several people who have questions when it comes to creating a histogram in Excel. Once you have learned exactly what it is you are doing, this can be completed in a matter of minutes with versions such as Excel 2010, 2013, and 2016.
What Is A Histogram?
[pullquote]A histogram has been defined as a numerical data distributed by graphical representation.[/pullquote] Still unclear of what it is you are doing? Maybe it would be easier to look at it this way. Have you ever represented numerical data with a column or bar chart? Specific instruction can be found here.
A histogram is a unique column chart with each column representing an element’s frequency with a specific range. For instance, a histogram could be used to display how many days a gallon of gas was a certain price, tracking the number of days when a specific inventory was a particular rate, or even how many days the temperature reached a certain temperature.
A Histogram Saves The Day
I can’t begin to tell you how many times using one of these charts has not only saved me time but has also been the highlight of a presentation. For instance, there was a time the firm I currently worked for was meeting with a group of potential customers in Chicago.
The mere thought of landing this big of an account had my managers and the office executives on edge. This was going to be the big one. Bringing this group of clients on board meant adding four zeros to everyone’s bonus check. We needed to demonstrate exactly how installing and paying our crew to monitor the security systems we offer would save money over our biggest competitor.
This hotel chain had many hotels in every state of the country. Not only would the sale of our equipment be huge, by using us to monitor and maintain the systems, our company would have a huge recurring revenue.
IMAGE: PEXELS
The research team I had been assigned to spend several hours every day for weeks studying and compiling the numbers that would show why using us made more sense, and we needed to be able to present the information as simply as possible. As much time as we had invested in the project, you would think we would have been smart enough to make sure the presentation was available on more than one computer. Well, practice makes perfect, they say, and nothing makes more sense then practicing with the help of tutorials.
Two other members of the team and I left our hotel in a cab and headed off to conference center where the meeting was to take place. We had scheduled our time to make sure we arrived about 45 minutes before we were expected. After checking in with the secretary and making our way to the room to prepare, we realized my colleague had left his laptop back at the hotel.
My laptop had all of the information from our research, but the actual presentation was no longer available. With time working against us, using the Excel software on my computer was the only option. I scrambled to configure all of the numbers as quickly as possible. Not only did a histogram do the job, it looked more professional and was easier to understand than the original presentation we had planned.
We not only succeeded as a team when it came to landing the new account, my quick reaction and the quality of the result led to a promotion as the head of our research department. Excel had saved the day in more ways than one.


COMMENTS