There is no question that people lately are getting buck wild with infographics. Most of us are information junkies who can’t get enough of the daily data that is constantly in our faces. We love it all even more when it’s organized in a creative way where it’s easy to understand, like an infographic.
Just the other day I wrote about how infographics are now being made with 3D props and even people! Now I have a new twist on this fun topic to share with you. After reading a New York Times article entitled Illustrating Your Life in Graphs and Charts, I realized that there is a whole part of our lives that I never considered before when it comes to infographics.
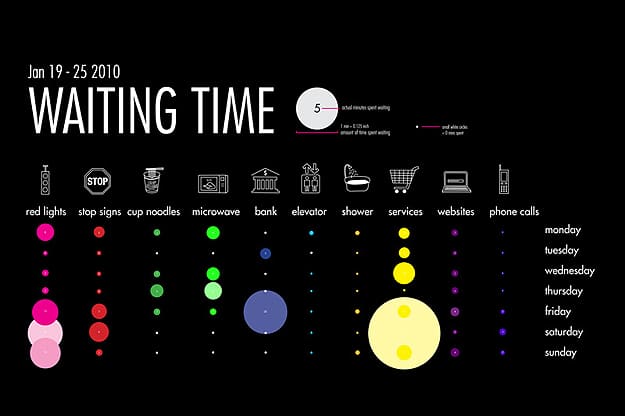
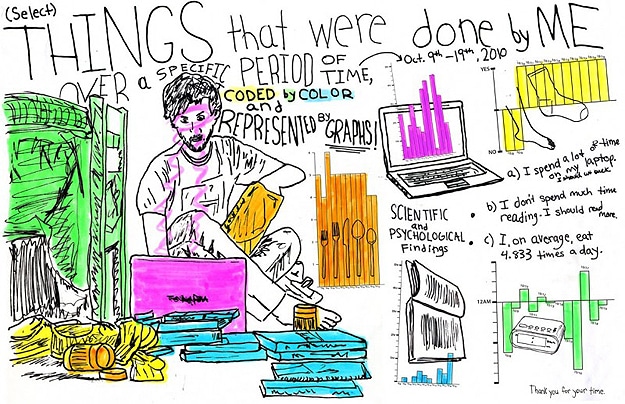
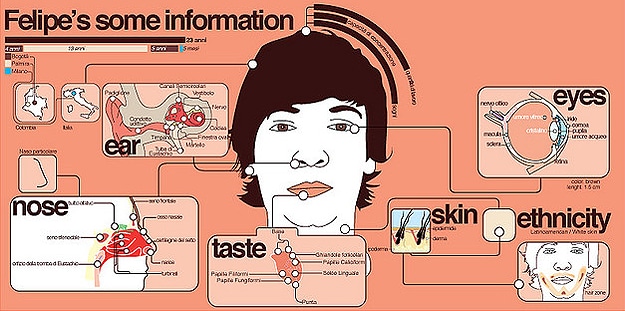
Wouldn’t it be nice to track and maintain certain pieces of our personal life in beautiful infographics? I can think of so many applications where this would be fun. Whether tracking how much we’re exercising each week, how much time we’ve spent on social media, or what types of beer our friends like the most, there is an infinite number of fun details we could track about our own lives everyday. There are even health applications. If you are diabetic, you might want to track your blood sugar levels.
The point is, it’s your very own story, illustrated in a way you’ve probably never seen before. Here’s the best part… We don’t have to be a designer or spend a lot of time to make these data pictures. There are lots of websites already set up and ready to help us with this project, and many of them even have iPhone apps available to further simplify the process. Here are just a few:
Daytum (my favorite, tracks any data)
Tableau Public (cool tool, turns your data into a pic very fast)
TouchGraph (tracks facebook data)
Fitness Journal (tracks health and fitness data)
Daily Mile (like a social media site, makes a map of your running route)
Wordle (creates pictures of words you enter, “word clouds”)
Make Use Of (this has links to more tools, sites and info about how to make your personalized infographics more stunning)
I hope you found this information useful! If you create one of these infographics, I hope you will come back and share it with us. We’d love to see it!
Image Credits: [PsPrint] [felipitu’s flickr photostream]
In the swiftly advancing domain of B2B digital marketing, the significance of B2B SEO as…
Conveyor rollers play a central role in the efficient operation of numerous types of material…
In today's technology-rich environment, having the most up-to-date smartphone is not just about staying in…
What is business agility? - No matter what industry a business is in, there is…
Roof damage is not merely an aesthetic concern for commercial property owners; it poses significant…
In the modern, digitally-driven world, managing data effectively stands as a key for organizational success.…