Tracking and analyzing your website’s analytics is an important step in the recipe for online success, but if you don’t dig statistics, it can be boring. Here at Bit Rebels, we are lucky that Richard is a ‘numbers person’ and tracks every detail of every statistic in all kinds of different ways. If you aren’t like that, and if you don’t work with someone on your website who is like that, you have another option which can make tracking your analytics fun. It’s a free infographic of your website’s Google Analytics delivered to you each week.
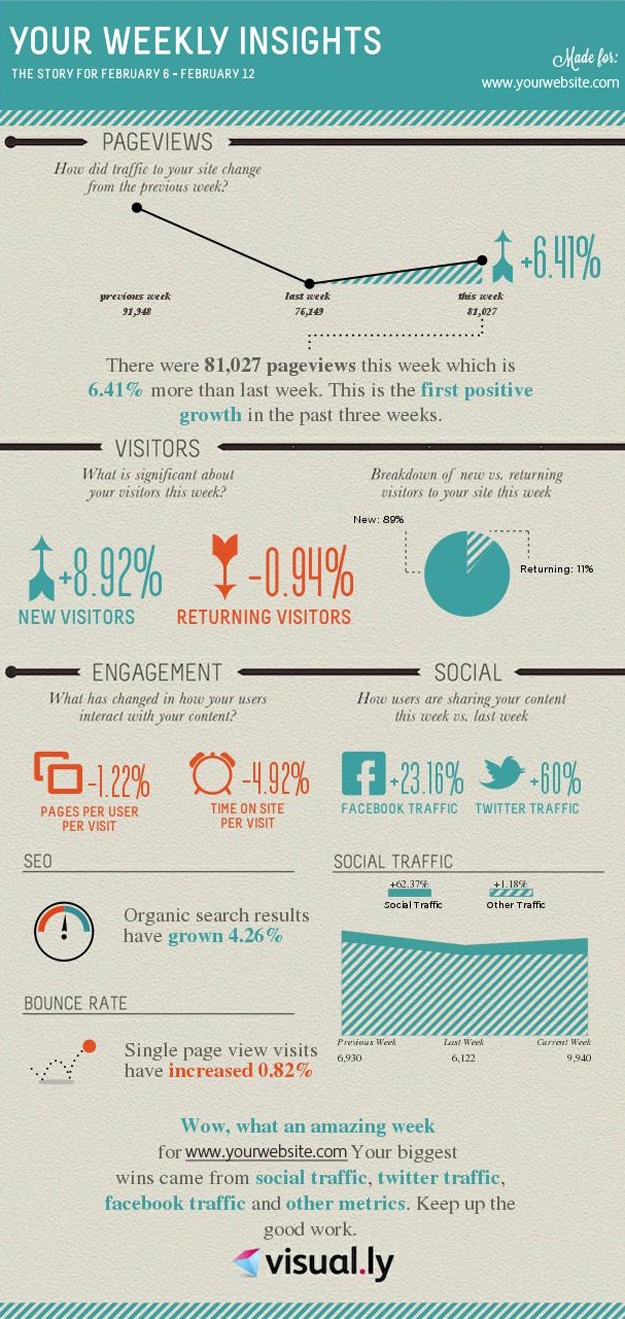
My friend Tal Siach, co-founder of visual.ly, told me about a free infographic analytics tool that just launched on visual.ly yesterday. They’ve been working on the template for a while, and it’s basically an easy to read, visual reporting tool. You can even sign up to receive this custom, free infographic displaying your Google Analytics delivered to your email inbox each week. The infographic will change colors based on the results. Since all the information about your website will be presented in an infographic like what you see below, it will make it easy for anyone to get a quick, complete visual representation about what’s going on with their website’s statistics.
If you would like to try this service for yourself, you can click Google Analytics Report. It will prompt you to sign in with your visual.ly account. If you don’t have a visual.ly account, you’ll need to sign up for one before starting this process. Then, you’ll be asked to sign in with Google. You’ll see the message, “A third party is requesting permission to access your Google Account.” From there, it will all make sense. Good luck, and I hope this infographic helps you to understand your Google Analytics better!
Powered by increasingly sophisticated photo booth applications and fueled by our relentless craving to document…
Think of a world-class athlete training for the Olympics. They spend countless hours honing their…
In the swiftly advancing domain of B2B digital marketing, the significance of B2B SEO as…
Conveyor rollers play a central role in the efficient operation of numerous types of material…
In today's technology-rich environment, having the most up-to-date smartphone is not just about staying in…
What is business agility? - No matter what industry a business is in, there is…