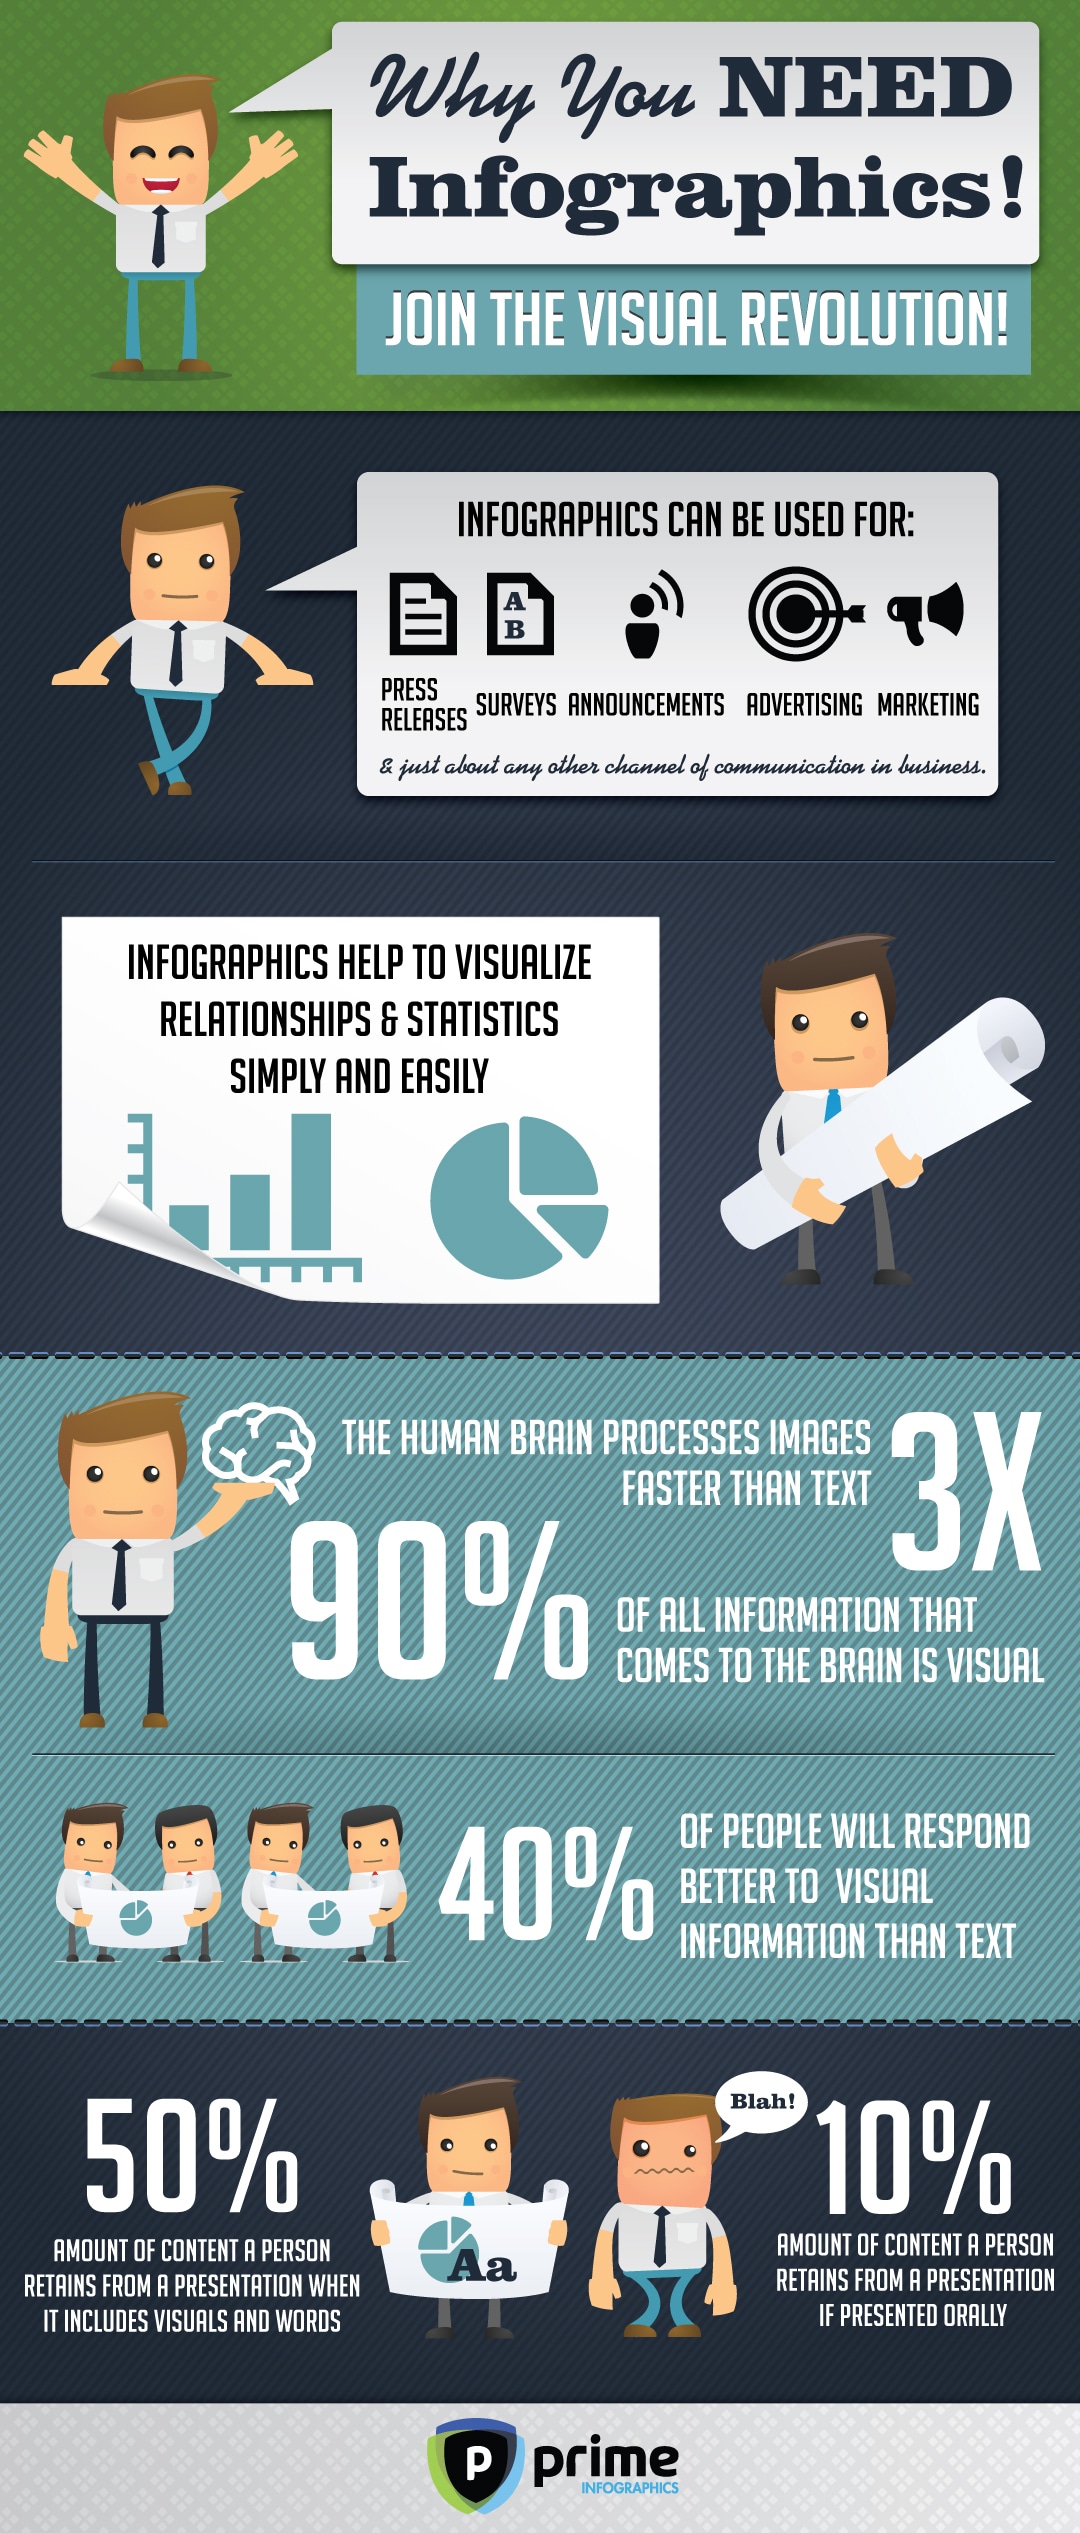
It’s easy to feel completely stupid after a class or a presentation where someone has been talking for one and a half hours or more. The classic trend is that you probably don’t remember half of what was said. Don’t worry, you are not alone feeling in this way. Everyone is not born with a memory that sucks up all the information that is thrown at our senses. As a matter of fact, on average a person remembers only 10% of everything that has been said during an oral presentation. During a visual presentation, on average a person remembers 50%. That is a huge difference and one that speaks highly towards the value of visual information, right? So where do I want to go with all this?
The curious thing is that there are so many blogs on the Internet, it’s almost impossible to count them all. My question is how come almost 90% of them are made up of mostly just text? That goes against everything we know or have recently learned about how we retain oral and written information. The thing is, what some people don’t recognize is that visual information will make their blog posts stick faster and longer than just text information.
You might wonder why I am typing this to you in just text then. Well, you can’t easily show everything in visual information. That would be a nightmare. But when combining the two, we have an absolutely unbeatable combination. If we can, in a straight forward and easy way, present visual information in a format that really draws the reader in, we will have hit a home run.
Prime Infographics did some research on this topic, and the results are mind boggling if I may say so myself. They have presented it in an infographic called “Why You Need Infographics!” Just the fact that the human brain processes visual information three times faster than any other piece of information should really make us scramble for some infographics, right? Correct! You really should if you want to attract people to your website.
Visual information isn’t just processed faster by the brain, but there is another reason it’s effective as well. The thing is, 90% of all the information that we take in is visual, which of course would explain why the brain is so quick at processing it. But the thing with visual information is also that people have become lazy, and we must never forget that. Unless it’s a really good story or article, people don’t want to read through a whole page of text when he or she could do something else more fun. So, throw in an infographic with visual information, and you’ll have a winner.
It’s not hard to captivate a reader. I mean, even I can do it as you see. You’ve come this far, and you are still reading. That must mean that you have probably checked out the infographic first and then either quickly parsed through this article, or you have a dedicated interest for what this is all about. That must mean the visual information you were shown below has done its job, and now you are deepening your knowledge on the subject. Visual information is really what is going to make your website flourish and attract a lot more visitors than you ever thought was possible with your blog. If you can see it, it exists, right?
Visual Information & How It Affects Website Traffic
(Click To Enlarge)
Via: [visual.ly]

COMMENTS