In the intricate world of financial markets, accurate prediction and decision-making are integral skills for a successful portfolio. Utilizing various technical analysis tools is undeniably paramount in building a robust trading strategy. In this respect, one particular method has been utilized for centuries to study price patterns and predict market movements, candlestick patterns- candlestick charting.
In this article, we’ll walk through the meaning of bullish and bearish candlestick patterns, their significance in trading, how to leverage them for maximal trading profits, and finally, learn ways to mitigate potential risks. So, let’s plunge into this engaging journey and extract the essence of successful candlestick trading.
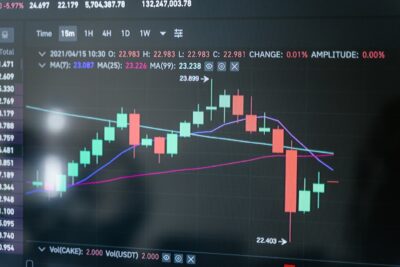
IMAGE: PEXELS
Understanding The Basics Of Candlestick Patterns
Just like Newton’s apples and gravity theory, the financial sector was forever changed when Japanese rice traders started using a pictorial method to track the price movement of rice contracts – the candlestick charts.
Debunking its complexity, a candlestick depicts four price points for a given time frame: the opening, closing, highs, and lows. This provides more information compared to a standard line chart, allowing traders to understand price movements vividly.
It was the Japanese trader, Munehisa Homma, who realized that the psychological aspects of the market participants influenced the price. Munehisa Homma deployed this understanding and devised the candlestick patterning method.
Today, you can find ample resources, like this informative candlestick charts article, explaining this concept in detail. While these patterns tremendously aid in informed trading decisions, a major aspect of them is their bullish or bearish indications.
Understanding this paramount distinction can enhance the profit potential for traders. So let’s dive deeper into the characteristics and implications of bullish and bearish patterns in the following sections.
The Significance Of Bullish Candlestick Patterns
Bullish candlestick patterns signal an upcoming price rise. They are a beacon of hope, indicating an upcoming phase of positive market movement. Bullish patterns occur during downtrends and suggest a potential reversal of the trend.
Identifying these patterns aids traders in making informed buying decisions and strategically entering the market. A few common examples of bullish candlestick patterns are the Hammer, Morning Star, and Bullish Engulfing Pattern.
Each pattern implicates a unique trader sentiment and provides multiple trading opportunities. However, trader judgment, reinforced with secondary confirmation from other technical indicators, can lead to the successful execution of trading strategies.
Unquestionably, bullish candlestick patterns can be a tool for prudent risk management. Regardless of the trader’s style or the market conditions, understanding these patterns allows us to anticipate future price movements and make entries at the most suitable prices.
Bearish Candlestick Patterns: A Guide To Safe Exit
On the other side of the coin, bearish candlestick patterns signal a potential decline in price. They are typically spotted at the peak of an uptrend and indicate a potential trend reversal downwards.
These patterns assist traders in making strategic sell decisions, thus mitigating potential losses by exiting at the appropriate time. Common examples of bearish patterns are the Shooting Star, Evening Star, and Bearish Engulfing Pattern.
Recognizing these patterns helps traders intelligently scale out of the markets, thereby preserving their capital. In both bullish and bearish scenarios, the key is correctly identifying the patterns and interpreting them in light of the existing market context. Coupled with other technical analysis tools, they can boost trading success and minimize potential losses.
Optimizing Success While Mitigating Risks
As traders wade through the tumultuous waves of financial markets, armed with the understanding of bullish and bearish patterns, they must also be mindful of the inherent risks.
Naïve reliance on these patterns can lead to mistakes and losses. As a trader, it is crucial to overlay these patterns with your own market knowledge and contextual understanding for optimal decision-making.
Furthermore, understanding that candlestick patterns are not a foolproof system is essential. They are dependent on numerous factors, such as market volatility, liquidity, and news events, among others.
Therefore, their application should be coupled with strict money management principles for safe trading. Moreover, to consolidate the trading results effectively, it is advisable to keep fine-tuning the trading approach and strategy based on what works better.
In the thrilling world of financial markets, understanding and leveraging the power of bullish and bearish candlestick patterns can give traders an upper hand. They are valuable navigational tools that can enhance the accuracy of market predictions and enrich trading strategies.
Each pattern is a compelling storyline about market sentiment, enabling the reader to stay ahead of the curve. They are time-tested techniques that, when used wisely, can significantly elevate the trading experience.
They provide insightful entry and exit points, help mitigate risks, and enhance profits. Whether bullish or bearish, these patterns could be the key to unlocking more successful and profitable trades.
COMMENTS