The cryptocurrency markets have been subdued over the past 6-months. After skyrocketing higher in December of 2017, prices for most of the major cryptocurrency pairs tumbled during 2018. Volatility soars, but over the past 6-months, it has remained very timid. With volatility now picking up, here are a few ways to trade cryptocurrencies.
How To Measure Volatility
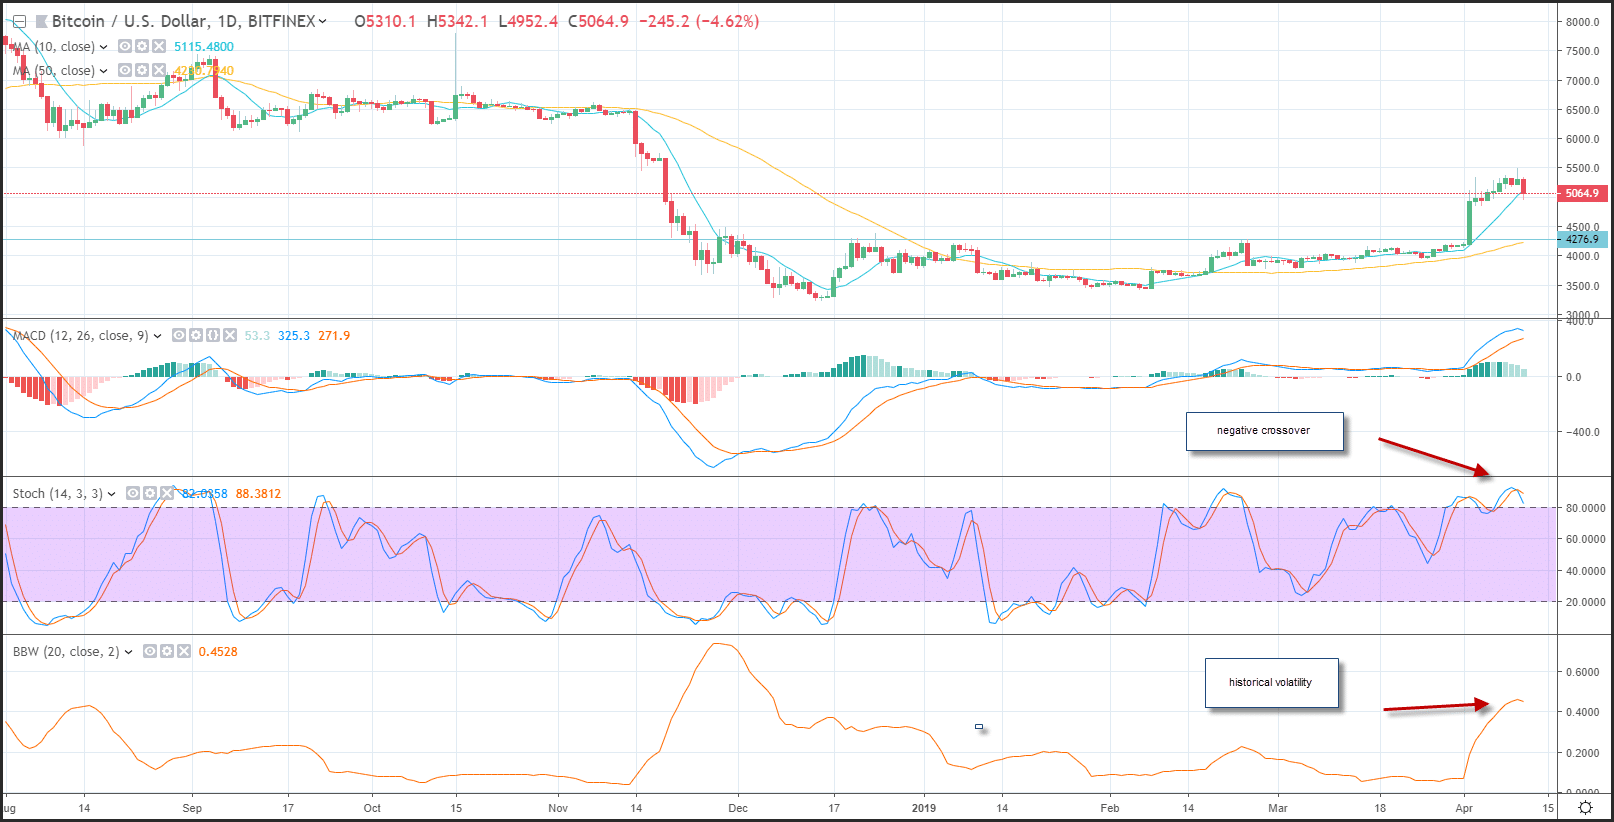
There are several ways to measure cryptocurrency volatility. One of the easiest ways is to evaluate the Bollinger band width. This indicator uses the difference between the high and low standard deviations above a mean which provides an easy to read indicator. You can see that at the beginning of April, volatility started to increase after flat-lining for most of 2018. With volatility on the rise, you can use both short-term and medium-term momentum to determine the future direction of bitcoin.
The Fast stochastic is an efficient indicator that allows you to determine the short-term momentum of crypto currencies. There are two ways you can use the fast stochastic to generate a signal. The first is a crossover. When a positive crossover occurs, positive momentum is beginning to accelerate. When a negative crossover occurs, negative momentum is accelerating. A second way you can use the fast stochastic is by determining a cryptocurrency pair is overbought or oversold. When the fast stochastic is above 80, the exchange rate is overbought. When the fast stochastic is below 20, the exchange rate is oversold. Overbought reading provides an opportunity to sell a cryptocurrency. An oversold reading offers an opportunity to buy a cryptocurrency.
Using The MACD
The moving average convergence divergence index (MACD) is another very good momentum indicator to use as volatility increases. You can use the MACD in multiple ways and find momentum over different time frames. The default for the MACD is a medium-term setting.
The MACD crossover is the most common way to use the indicator. Positive momentum begins to accelerate when the MACD index generates a crossover buy signal. This occurs as the MACD line (the 12-day moving average minus the 26-day moving average) crosses above the MACD signal line (the 9-day moving average of the MACD line). Negative momentum occurs when the MACD generates a crossover sell signal. This occurs as the MACD line (the 12-day moving average minus the 26-day moving average) crosses below the MACD signal line (the 9-day moving average of the MACD line).
Using The MACD Histogram
There is also an index called the MACD histogram. This is in histogram format. The MACD histogram also generates buy and sell signals. You can also evaluate the trajectory of the MACD histogram to determine if momentum is accelerating or decelerating.
Using Momentum When The Markets Become Volatile
Momentum is an indicator that is best used when the market becomes more volatile. When markets are consolidating, momentum indicators will sometimes provide false signals. Make sure you see volatility return when you attempt to use these indicators when evaluating the future direction of a cryptocurrency.
Disclaimer: This is not financial advice. The above references an opinion is for information purposes only. It is not intended to be investment advice. Seek a duly licensed professional for investment advice. Invest responsibly and never invest more than you can afford to lose.
If you are interested in even more business-related articles and information from us here at Bit Rebels, then we have a lot to choose from.

COMMENTS