There truly isn’t anything that can’t be explained, illustrated, built or conceived with Lego bricks. If you do a search on this blog for Lego articles, you will be blow away by the creativity and information that can be portrayed in a Lego build.
When you look at just one Lego brick, it seems so simple and uneventful, but when you start putting them together, a whole new world of possibilities opens up. Once you get into it, it’s easy to see that the world is limitless and anything is possible.
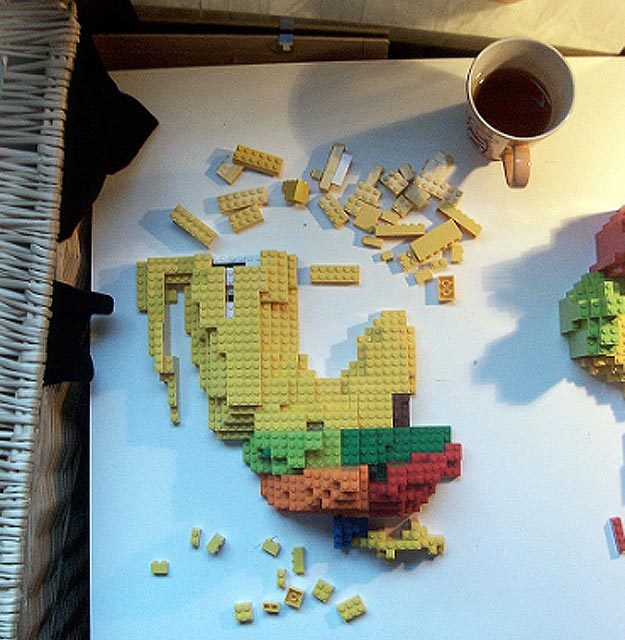
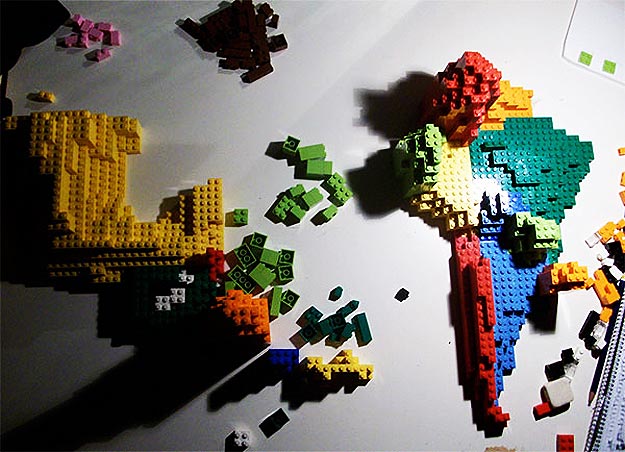
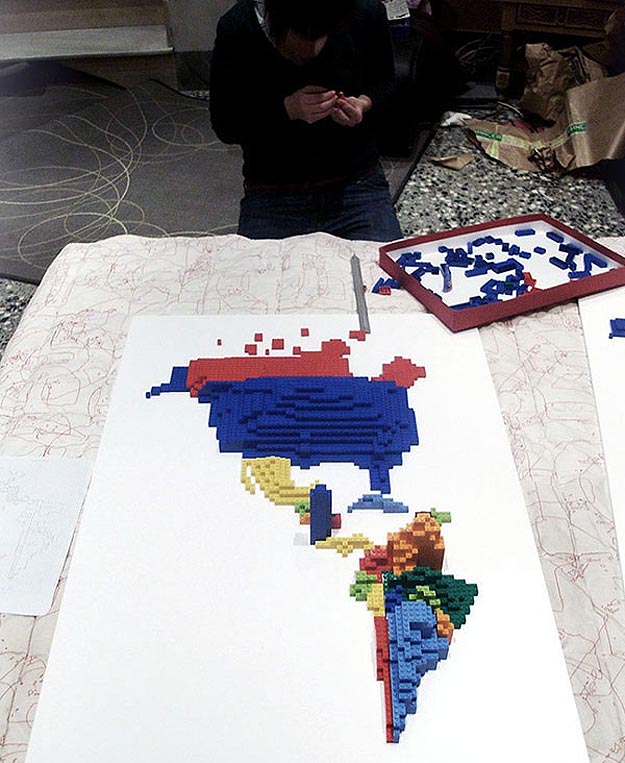
Samuel Granados understands this. He wanted to find a way to illustrate in a 3D format the emigrants and immigrants (migration data) in a particular geographical location (the Americas). And of course, he did it with Lego bricks. I think that was a brilliant choice of materials. One side of this Lego map shows the emigrants and the other side shows the immigrants. The number of bricks he used in a particular area directly corresponds with the volume of people moving in and out of those areas. In other words, the taller the stack of bricks, the more people in that area.
I guess you could say this is like a 3D infographic. He framed it, and it hung in a Madrid museum through the end of last month. The only thing that would make this better for me is if there was a guide that explained exactly how to read it. Either way, this is definitely awesomeness defined as @Minervity would say!
Via: [Infographics News] [Technabob]


COMMENTS