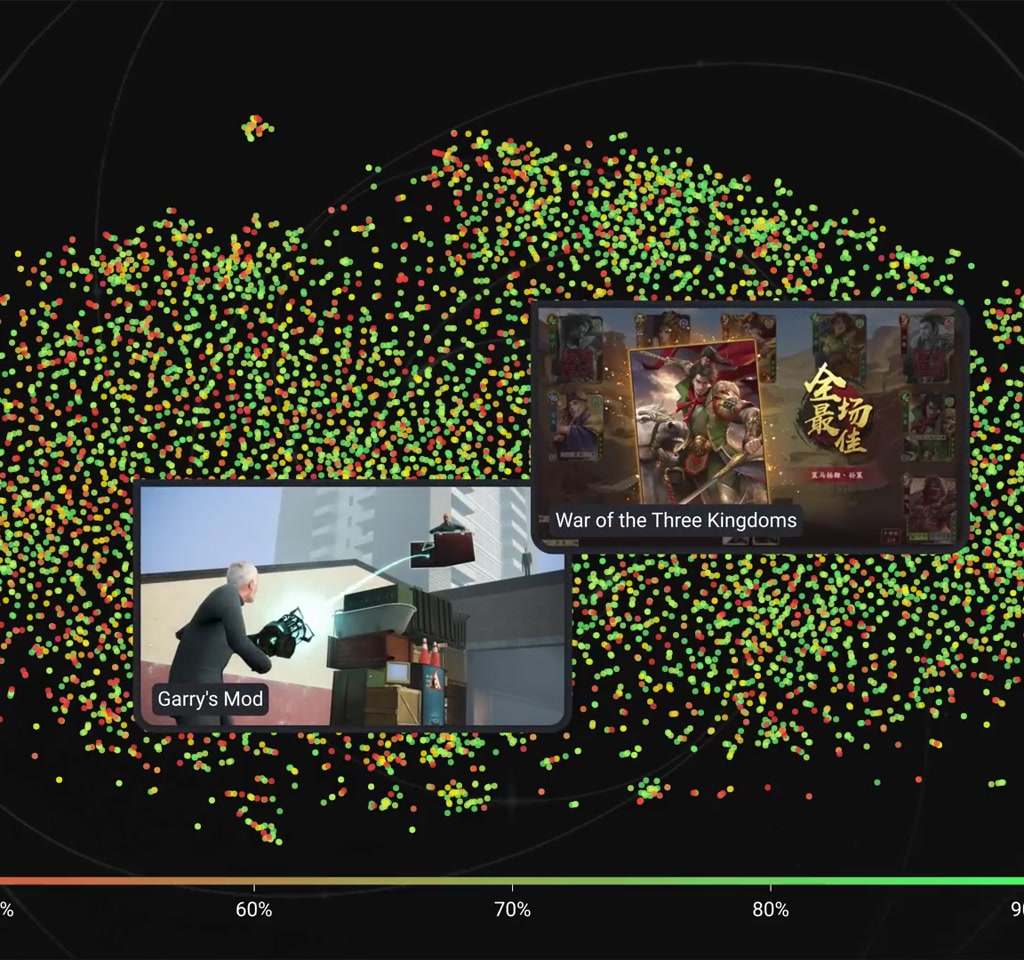
The idea is simple and persuasive: download a single thumbnail from every Steam store page, turn each image into a numerical fingerprint, compress those fingerprints into a two-dimensional plane and see what groups together. The result, the Gaming Map, clusters titles that look alike so close that you can literally see genre, production value and even price tendencies as regions on the map.
The real significance here is not that a screenshot alone magically predicts hits. What actually determines whether this matters is that art direction, genre conventions and production values leave reproducible visual traces that a visual pipeline can detect. That means images become a readable signal about where a game sits on the spectrum from low-budget experiment to high-budget spectacle.
What most people misunderstand is the range of what a single frame can and cannot tell you. It can reliably separate 2D from 3D, identify very representative genres like racing or visual novels, and align with review counts and price tiers. It cannot reliably predict review sentiment, and broad causal claims about screenshots driving success do not hold up.
In this article we will walk through how the Gaming Map was constructed, what patterns stand out, and the concrete constraints that define when this approach is useful. Expect both clear correlations and clear limits, with numbers and tradeoffs that matter for anyone thinking about using visuals as analytics.
How The Gaming Map Was Built
The pipeline was straightforward at a technical level: collect promotional images from Steam, compute visual embeddings with EfficientNet v3, then reduce those high-dimensional vectors into two dimensions with t-SNE so humans can inspect clusters and gradients. That sequence—collect, embed, compress—frames what the map can and cannot reveal.
Data Selection And Sampling
The researcher pulled metadata and promotional images for every Steam game via the platform APIs and some web scraping, focusing on two image types: the first screenshot from the gallery and the wide header banner that sits at the top of the store page. This initially produced roughly 130,000 images of each type before downscaling to thumbnails for analysis.
Processing every image at full scale was not computationally feasible, so the dataset was narrowed to just over 10,000 games. The selection included every game with more than 3,000 reviews, about 3,700 popular titles, plus a 5 percent random sample of the remainder, roughly 6,800 smaller titles. That sampling strategy intentionally overrepresents commercially successful games, which matters for interpretation.
Visual Embeddings And t SNE
Images were converted into dense numerical vectors using a convolutional architecture called EfficientNet v3. Each image produced a descriptor of more than 1,500 numeric values capturing visual features. Those high-dimensional vectors were then projected into two dimensions using t SNE, which preserves local similarity while compressing global structure so it is human-readable.
What becomes obvious when you look closer is how much the representation echoes human intuition: screenshots with similar scene composition, color and texture sit together, while unique art styles become small islands on the edges of the map.
What The Map Actually Reveals
At a glance the Gaming Map surfaces a handful of robust signals: a 2D versus 3D divide, tight clusters where visual conventions exist, and visual gradients that align with both number of reviews and price bands. Importantly, visual clusters do not reliably predict sentiment as measured by share of positive reviews.
Overlaying Steam metadata on the visual map produced several consistent patterns. The most robust signals were these: a 2D versus 3D divide, genre clusters for visually consistent categories, a correlation with number of reviews, and a correlation with price bands. Crucially, sentiment, measured as share of positive reviews, did not align with image clusters.
The map separated 3D titles from 2D ones along a roughly left-to-right axis. Genres with highly representative imagery, like racing games with cars or visual novels with character art, formed tight clusters. Other genres, such as platformers or roguelikes, did not cluster cleanly, which suggests they lack a single, dominant visual shorthand.
Most of the high review games congregated in a dense region characterized by action-packed, gun-heavy, explosion-heavy screenshots. The implication is not that explosions cause reviews, but that high-budget action 3D titles share visual signatures and also benefit from larger studios and marketing that drive reviews and sales.
Price showed a similar, visually readable gradient. The left side of the map favored titles that align with higher price bands while the right clustered images that look lower budget. Players appear to associate certain visual aesthetics with production value, and the map quantifies that association.
Pixel-Level Signals That Matter
Simple pixel statistics explained a surprising amount of the map structure: dominant color, brightness and saturation form readable subregions inside the larger clusters. These features are cheap to compute and often line up with obvious art direction choices on store pages.
Beyond learned embeddings, simple pixel features also carried meaning. The dominant color across images, average brightness and saturation created readable substructure within clusters. For example, green tones dominated landscape-heavy regions, orange and reds signaled action and explosions, and pinks were common in anime or character art areas.
Brightness acted as a subdivision within broader groups. Horror images sat at the darker extreme, while arcade-style or minimalist UI images were brighter. Saturation clustered too: highly saturated promotional art tended to appear in regions associated with lower review counts and lower price perception.
These pixel-level cues are useful because they are cheap to compute and explainable. If a developer wants to see where a header image will read as realistic or stylized, simple metrics will often give a fast first approximation.
Limits And Two Concrete Tradeoffs
The Gaming Map is useful but bounded. Two tradeoffs matter most: the computational cost of broader coverage and the loss of fine detail when downscaling images. Those boundaries shape what questions the map can answer with confidence and which remain speculative.
Computational Cost Versus Coverage
A major constraint was computational feasibility. The project started with about 130,000 images per type but reduced the working dataset to roughly 10,000 games. That reduction is a clear tradeoff: processing everything would increase coverage and reduce sampling bias, but it would also require an order of magnitude more compute, storage and time. In practice this meant the map represents many popular titles well while smaller or very niche games are sampled sparsely.
Quantified context: the pipeline compressed vectors of more than 1,500 dimensions into two dimensions. Running that whole chain at scale, on hundreds of thousands of full-resolution images, would push resource needs from desktop-friendly to a cluster-level problem, increasing CPU and GPU hours by multiples rather than by small percentages.
Resolution And Labeling Tradeoffs
Another boundary is resolution and label fidelity. The images were downscaled into low-resolution thumbnails to speed processing. That introduces a loss of fine detail, so texture, small UI cues, and subtle typography get blurred out. That is one reason why sentiment cannot be predicted from a single thumbnail: the micro cues that might inform user experience evaluations are not reliably present at low resolution.
Sampling and labeling also matter. The dataset included every game with >3,000 reviews, which biases the analysis toward commercially successful projects. The inference you draw from the Gaming Map therefore only holds up when you account for that overrepresentation of popular titles.
Practical Uses For Developers And Researchers
The map performs best when answering targeted, practical questions: where a header image will position a title on the store shelf, which visual neighbors to study for art direction, or where automatic tagging based on visuals will likely succeed. It is not a shortcut to measuring gameplay or community sentiment.
The Gaming Map is most valuable when used for targeted questions rather than sweeping predictions. For instance, it can help with genre detection and auto tagging where visual conventions are strong, or act as a creative reference for art direction by showing visual neighbors and the production value signals associated with them.
From an editorial standpoint, the useful call is this: visuals are a credible proxy for production value and genre signal but they are not a substitute for gameplay analysis or community reception. Use the Gaming Map to find inspiration and to test how a game’s visual identity will be read, not to predict its critical or commercial fate.
How To Use Visual Signals Responsibly
Start with simple pixel diagnostics to place an image on the map, then inspect visual neighbors before drawing conclusions. Where the map leaves ambiguity, combine it with metadata or telemetry rather than extending visual claims beyond the evidence.
Gaming Map Vs Other Visual Methods
Put simply, the Gaming Map trades full coverage and micro detail for interpretability and speed. Compared to full resolution pipelines or human curation, it scales more cheaply and highlights broad production value cues, but it cannot replace fine-grained analysis or curated expertise.
Compared To Tag Based Or Metadata Methods: Visual maps capture aesthetics and production signals that tags often miss, but tags remain better for factual discovery like platform, features or explicit genres. Compared To Full Resolution Computer Vision: High-resolution processing can detect UI elements and typography that thumbnails lose, at much higher compute cost.
Who This Is For And Who This Is Not For
Best suited for developers, product teams and researchers who want a fast, visual sense of where a game will sit within a crowded store landscape and who need explainable, low-cost metrics for art direction or auto tagging.
Not suited for stakeholders who need reliable predictions of review sentiment, fine-grained UX problems, or precise causal claims about marketing effectiveness. Those questions require higher resolution data, gameplay telemetry or user testing.
FAQ
What Is The Gaming Map?
The Gaming Map is a two-dimensional visualization built from Steam promotional images. Images were embedded with EfficientNet v3 to produce numeric descriptors and then projected into two dimensions with t SNE so visual similarity becomes inspectable.
How Does The Gaming Map Use Steam Thumbnails?
The project used two image types from Steam: the first gallery screenshot and the wide header banner. These thumbnails were downscaled to speed processing and then converted into visual embeddings.
Can The Gaming Map Predict Review Sentiment?
No. The analysis found that share of positive reviews did not align with image clusters, so sentiment is not reliably predictable from a single thumbnail.
Does Image Resolution Affect The Map Accuracy?
Yes. Downscaling to thumbnails blurs fine detail such as textures, UI cues and typography, which limits the map’s ability to detect micro signals tied to user experience.
Is The Gaming Map Biased Toward Popular Games?
Yes. The dataset included every game with more than 3,000 reviews plus a 5 percent random sample of the rest, intentionally overrepresenting commercially successful titles.
How Can Developers Use The Gaming Map?
Use it for genre detection where visual conventions exist, art direction reference, and quick checks on how a header image will be perceived. It is a visual aide, not a market forecasting tool.
Can The Gaming Map Replace Gameplay Analysis?
No. Visuals show where a game chooses to play visually, not how well it plays. Gameplay analysis and community signals are required for quality and reception assessment.
What Are The Future Directions For This Approach?
A promising next step is combining visual maps with gameplay telemetry and community data to study how appearance, mechanics and word of mouth interact. Whether that combination can answer causal questions remains an open research question.
COMMENTS