Food is an integral part of any culture. Just like customs, language and even climate, from country to country, the food varies vastly. And every county’s national dish reflects the country, as it is built around what foods are readily available, cooking techniques and traditions in the country.
From icy terrain to sweltering deserts, each country has used what is accessible to them to create their national dish. Trying a national dish in its own country is normally where you find the best versions and is definitely a must. But have you ever wondered which countries have the healthiest and unhealthiest national dish?
Just like all foods, some national dishes are high in salt, but low sugar, or high in fat but low carbs. They’re quite a mixed bag; so it’s not as simple as you’d think. Luckily, the UK diet plan brand, Shake That Weight, have made the World Food Map. This creates a nutritional label of every county’s’ national dish.
Looking at food labels has become the norm for healthy eating. We all want each of those little boxes to be green and avoid the red. Have you ever wondered about national dishes and what their boxes would look like? Which dishes are healthy and which are unhealthy? Which country has more green and which more red? Here’s a quick glance at those that have the highest amounts of varies nutrients.

IMAGE: PEXELS
The Unhealthiest National Dishes
Looking at which national dishes have the most calories, carbs, fat, sugar, salt and protein, these countries will ruin your healthy eating:
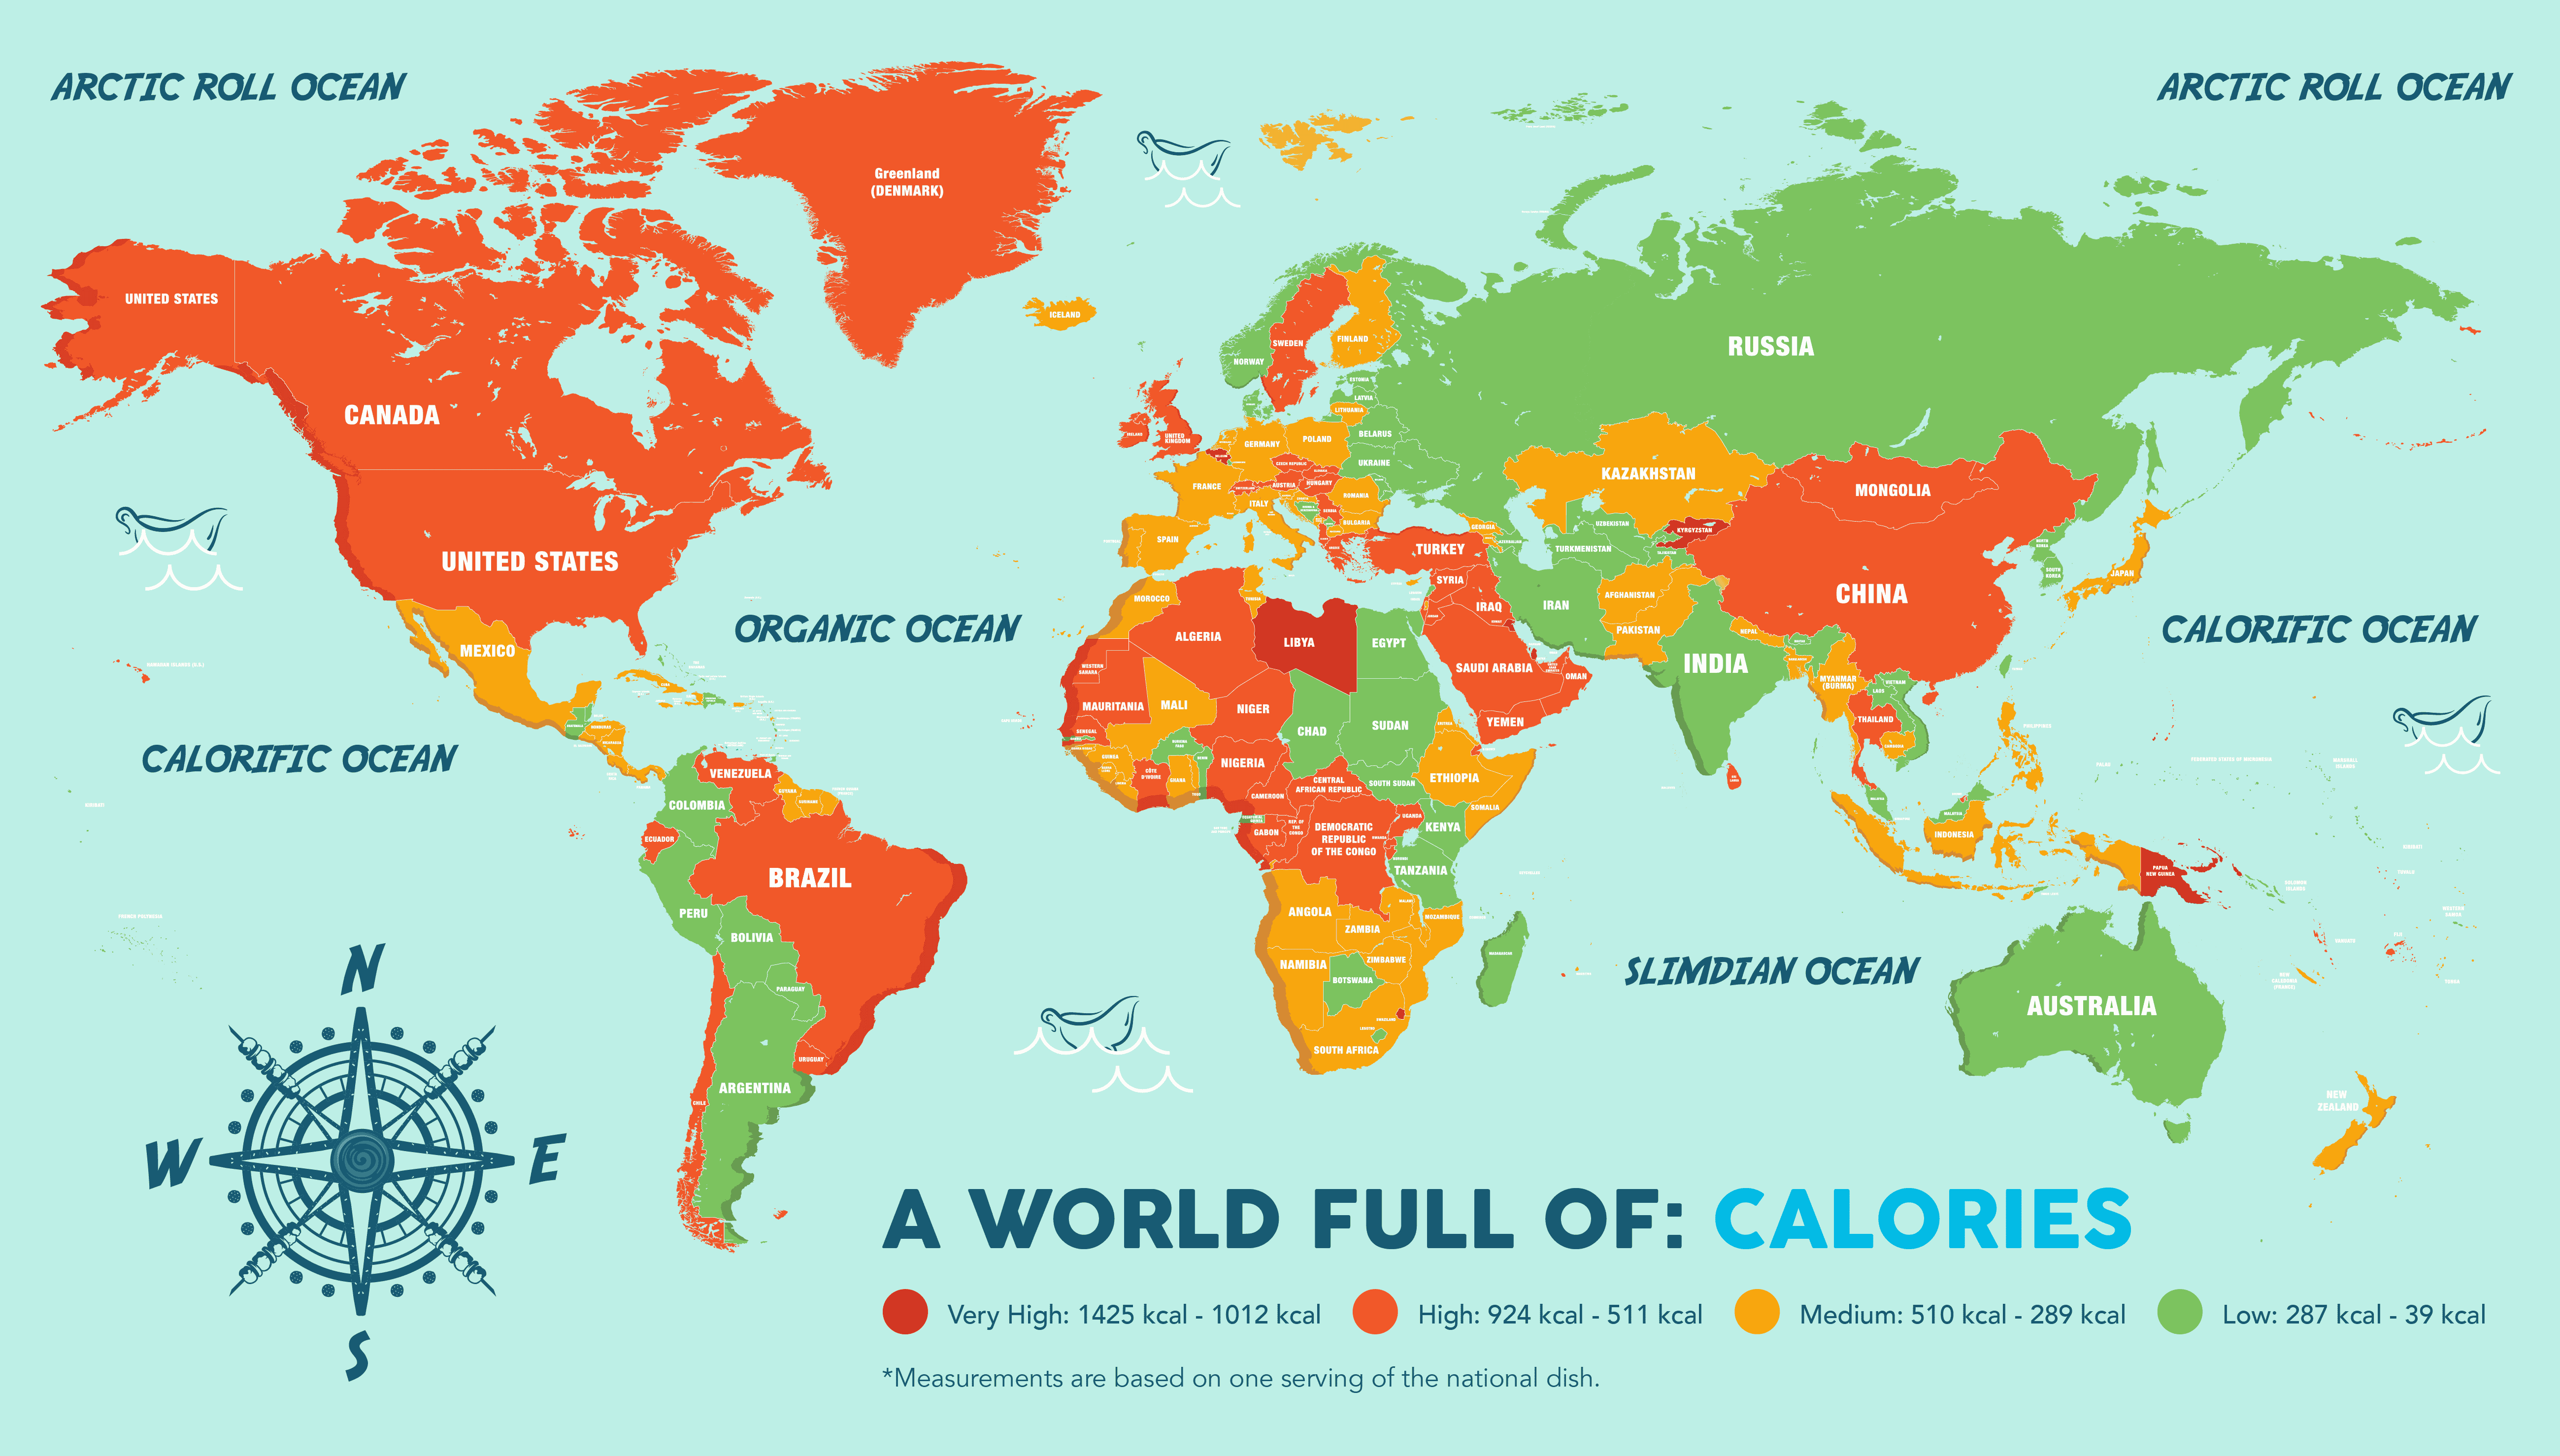
Calories
Langham – the national dish is Kyrgyzstan, which is a pulled noodle, meat and vegetable dish. The dish has 1424 calories, which is 71% of a woman’s recommended daily intake; 57% of a man’s.
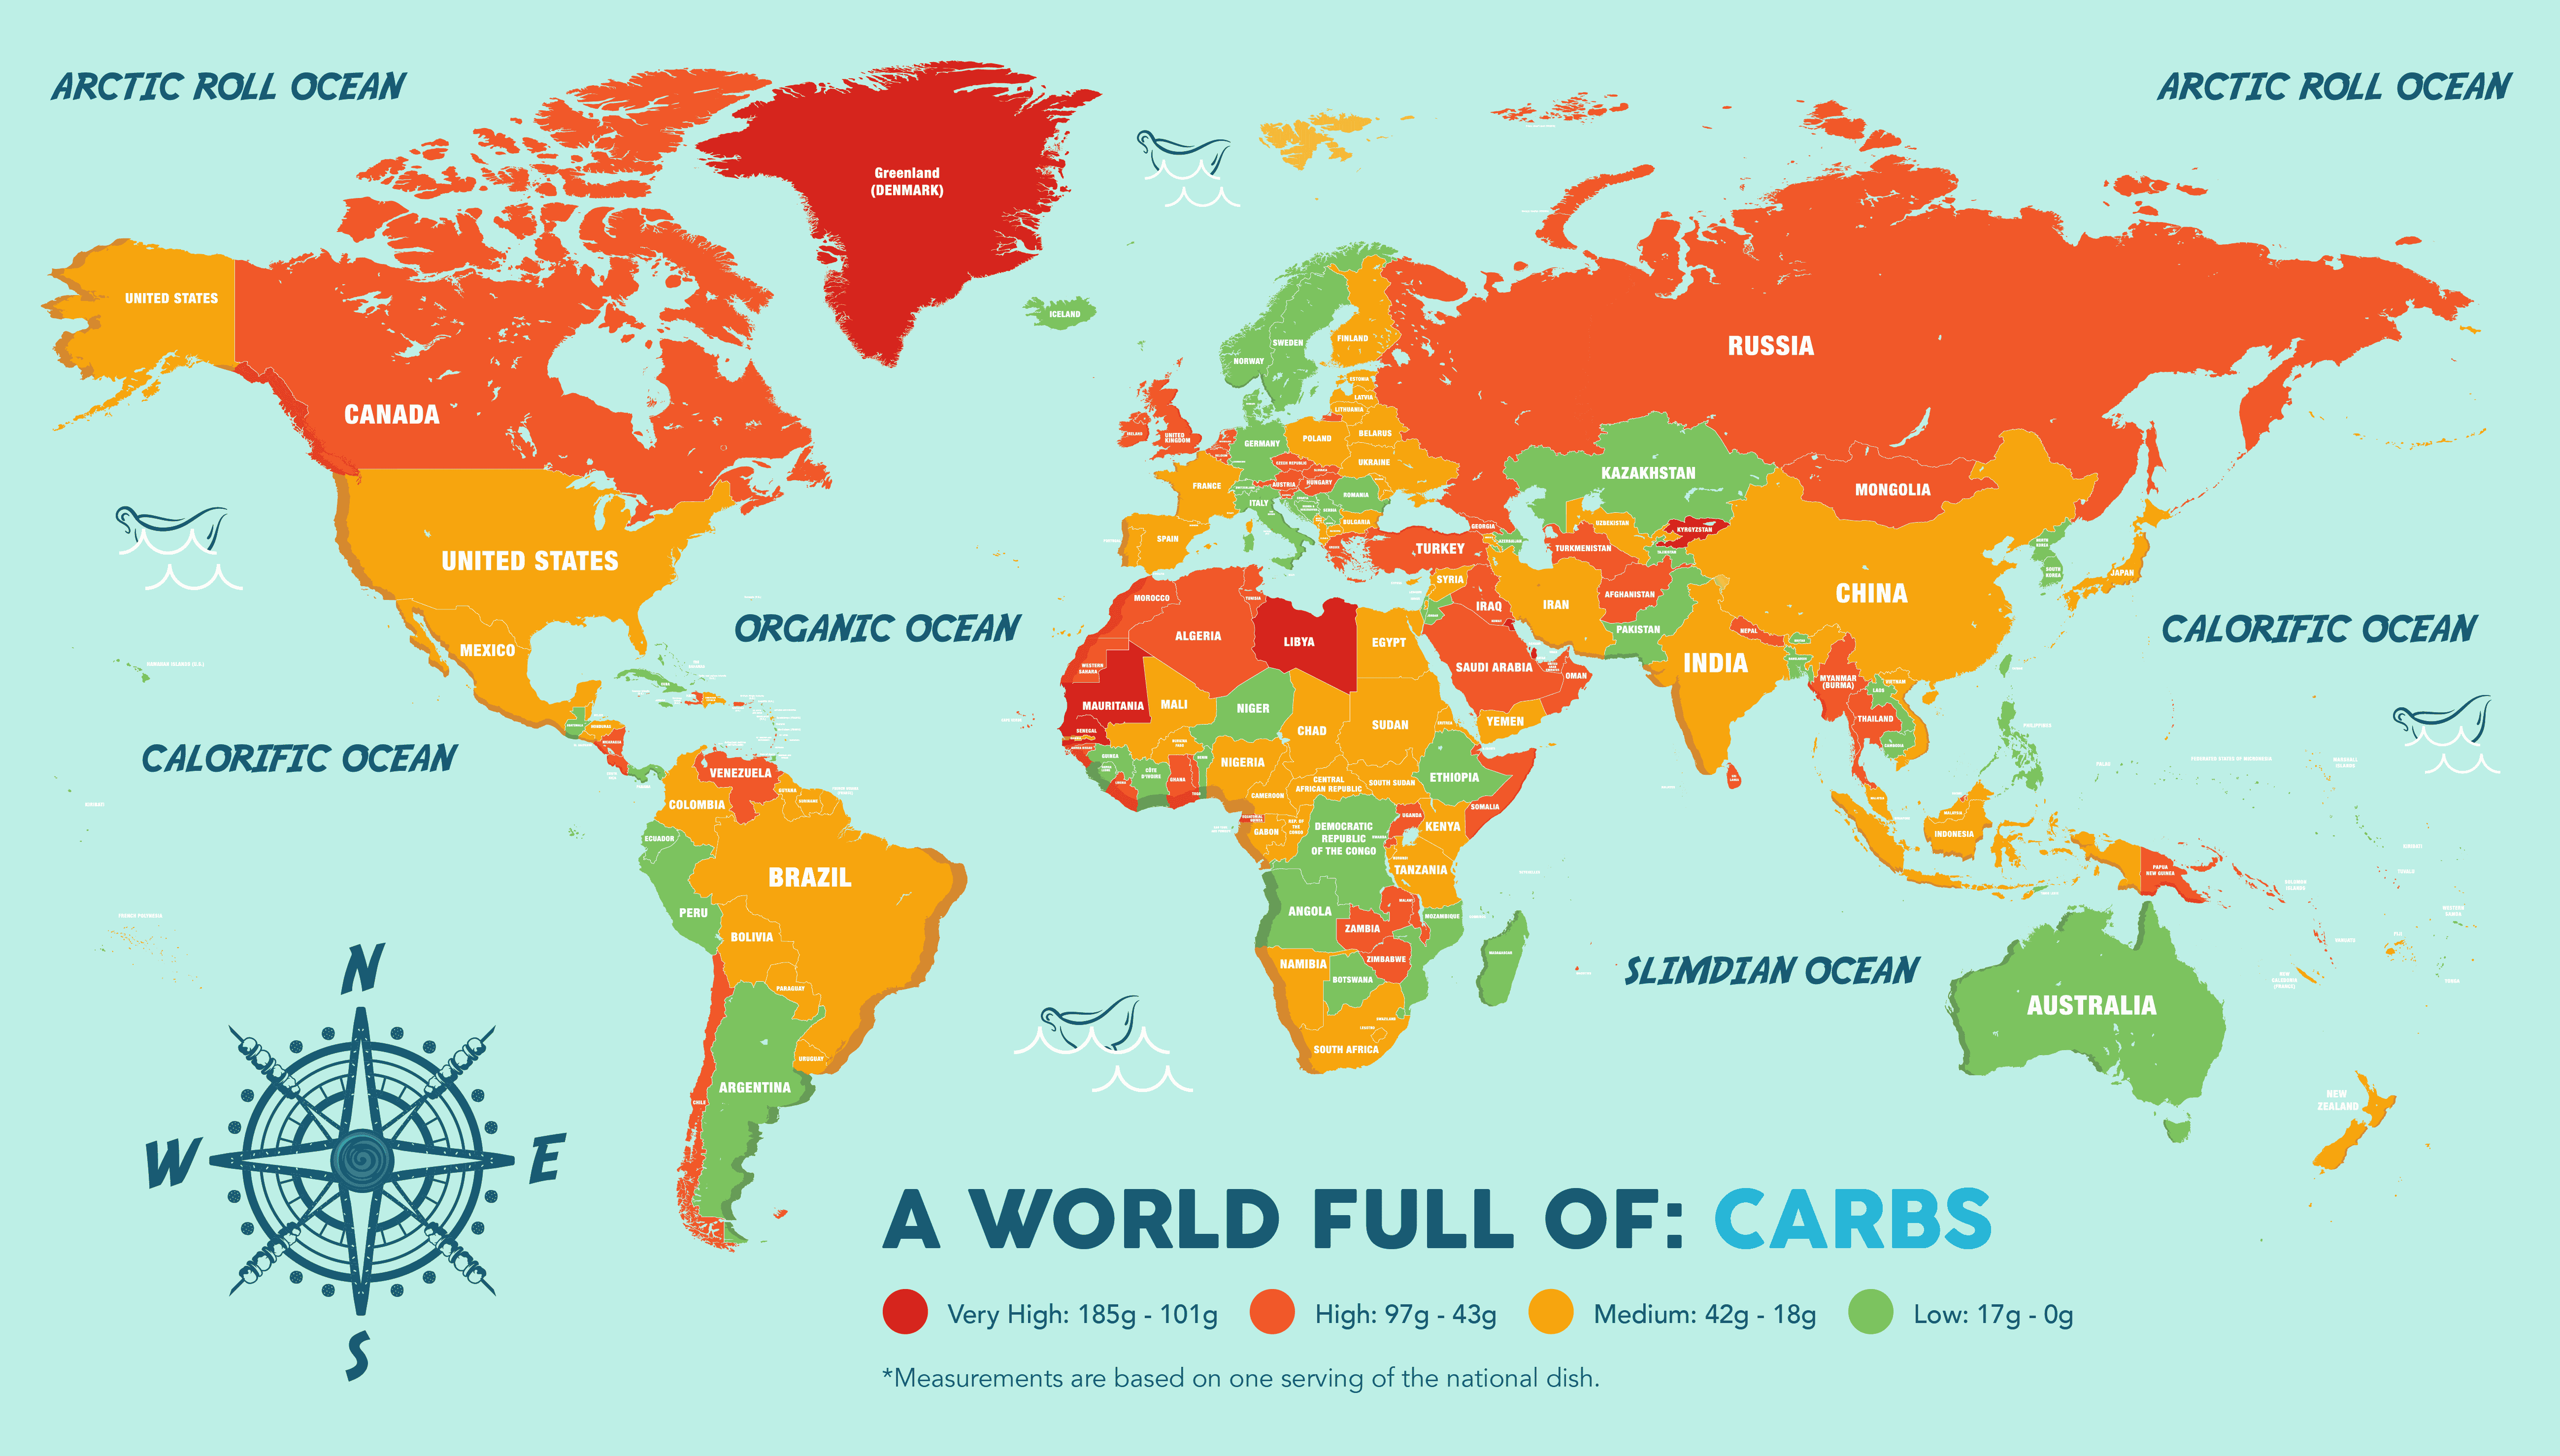
Carbs
Lybia is the biggest offender with carbs. The national dish, Bazeen, an unleavened bread, has a total of 185.42 grams of carbs. This isn’t so bad, as you are meant to eat at least 260g a day.
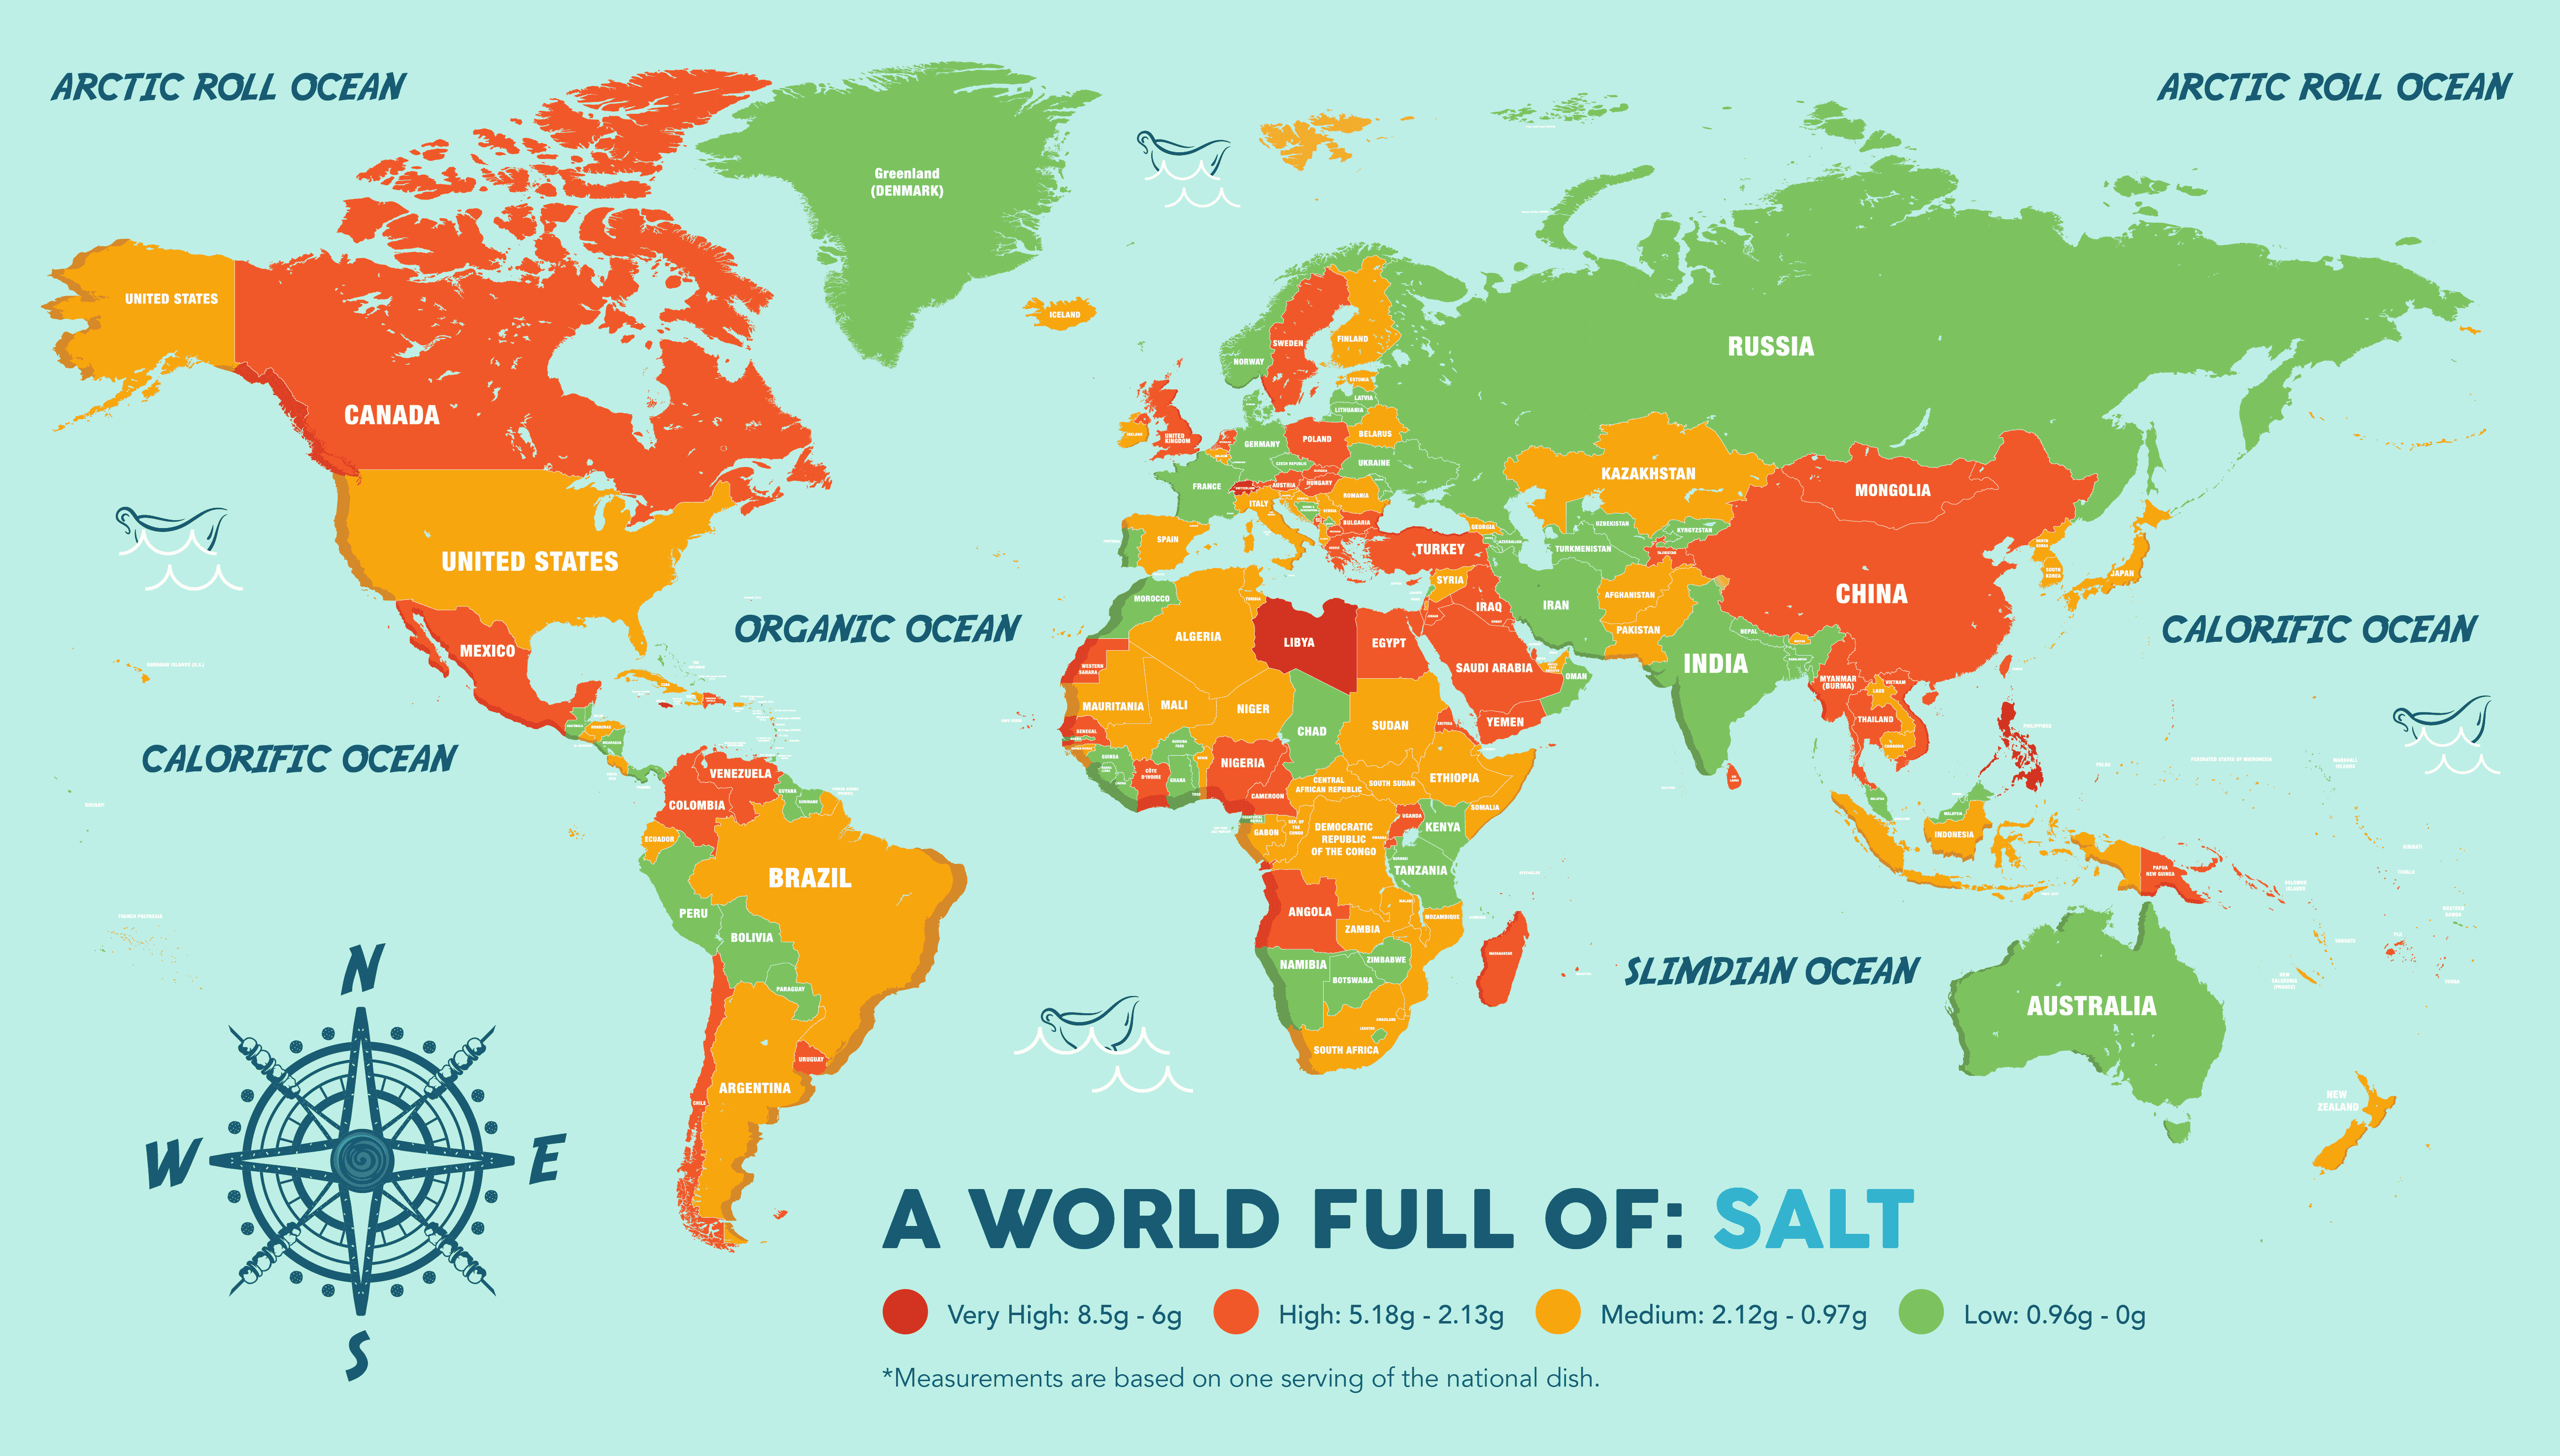
Salt
However, Lybia’s Bazeen also has the most salt, 8.56g in fact. As you’re meant to consume less than 6g a day, this is a huge amount and certainly no good for that healthy eating plan.
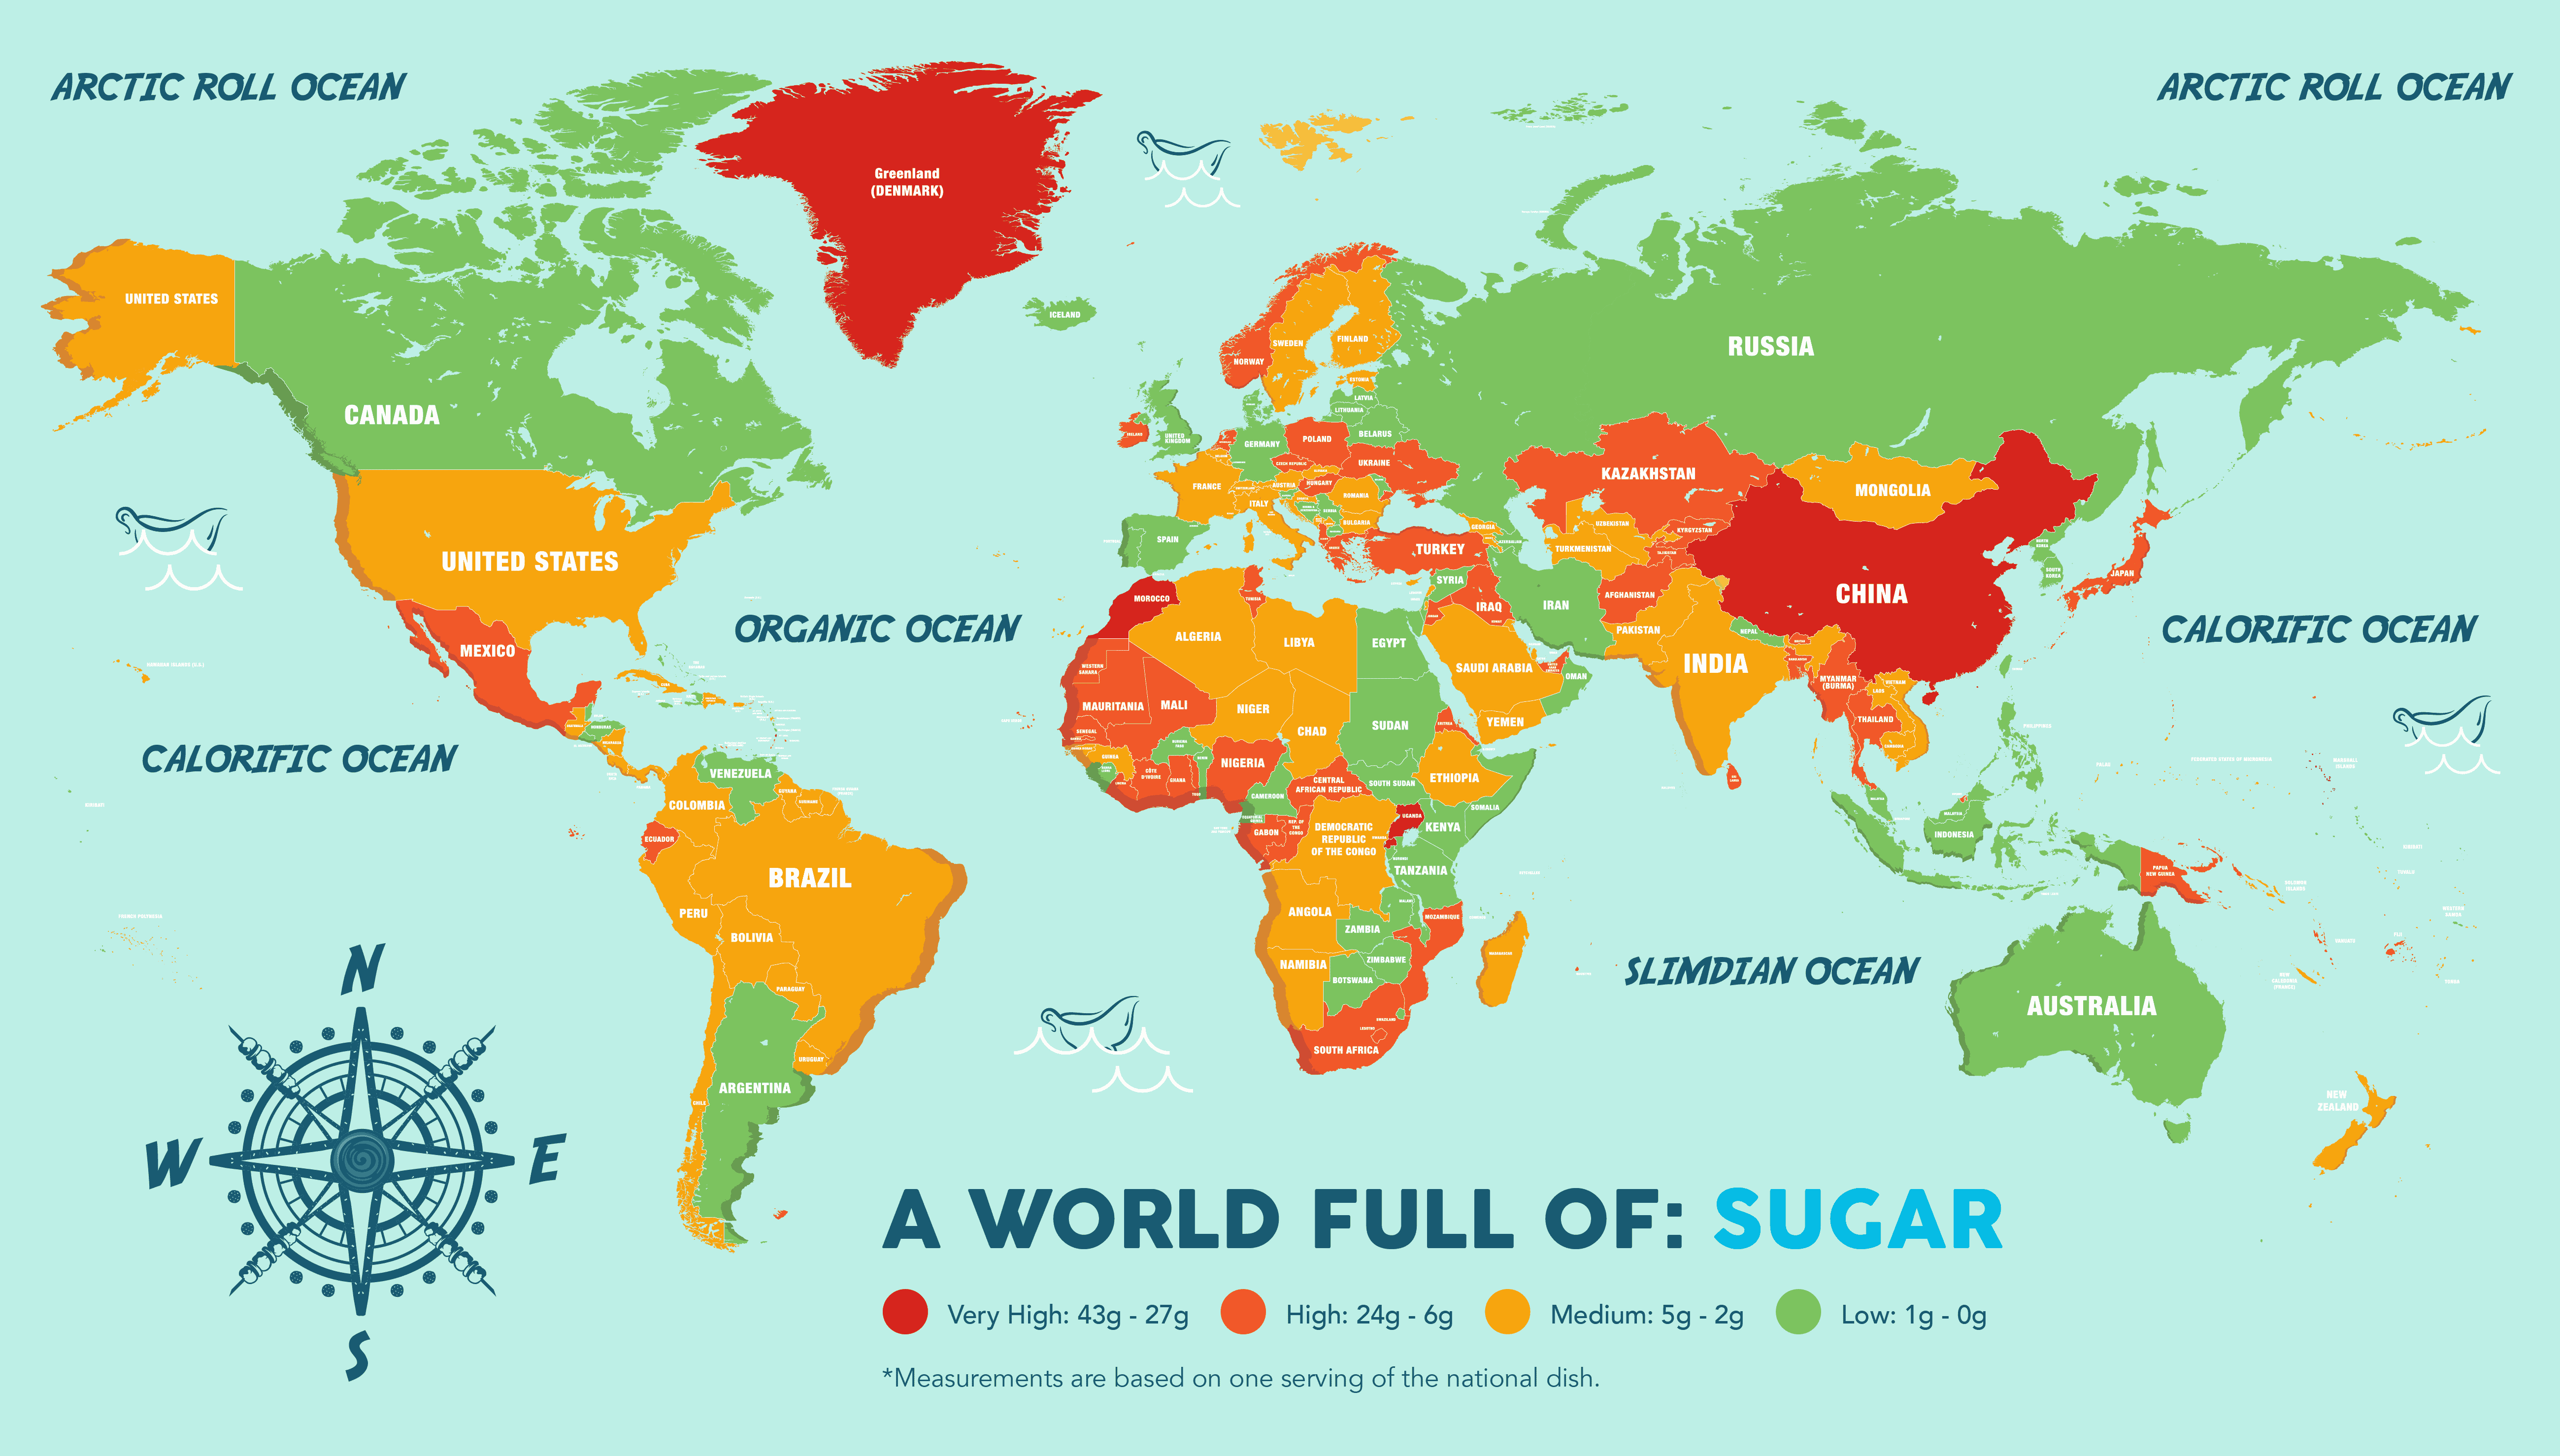
Sugar
Matoke from Rwanda is a dish of mashed green banana that can be served with a stew or on its own. This dish has the most sugar, with 43g, 48% of your daily allowance.
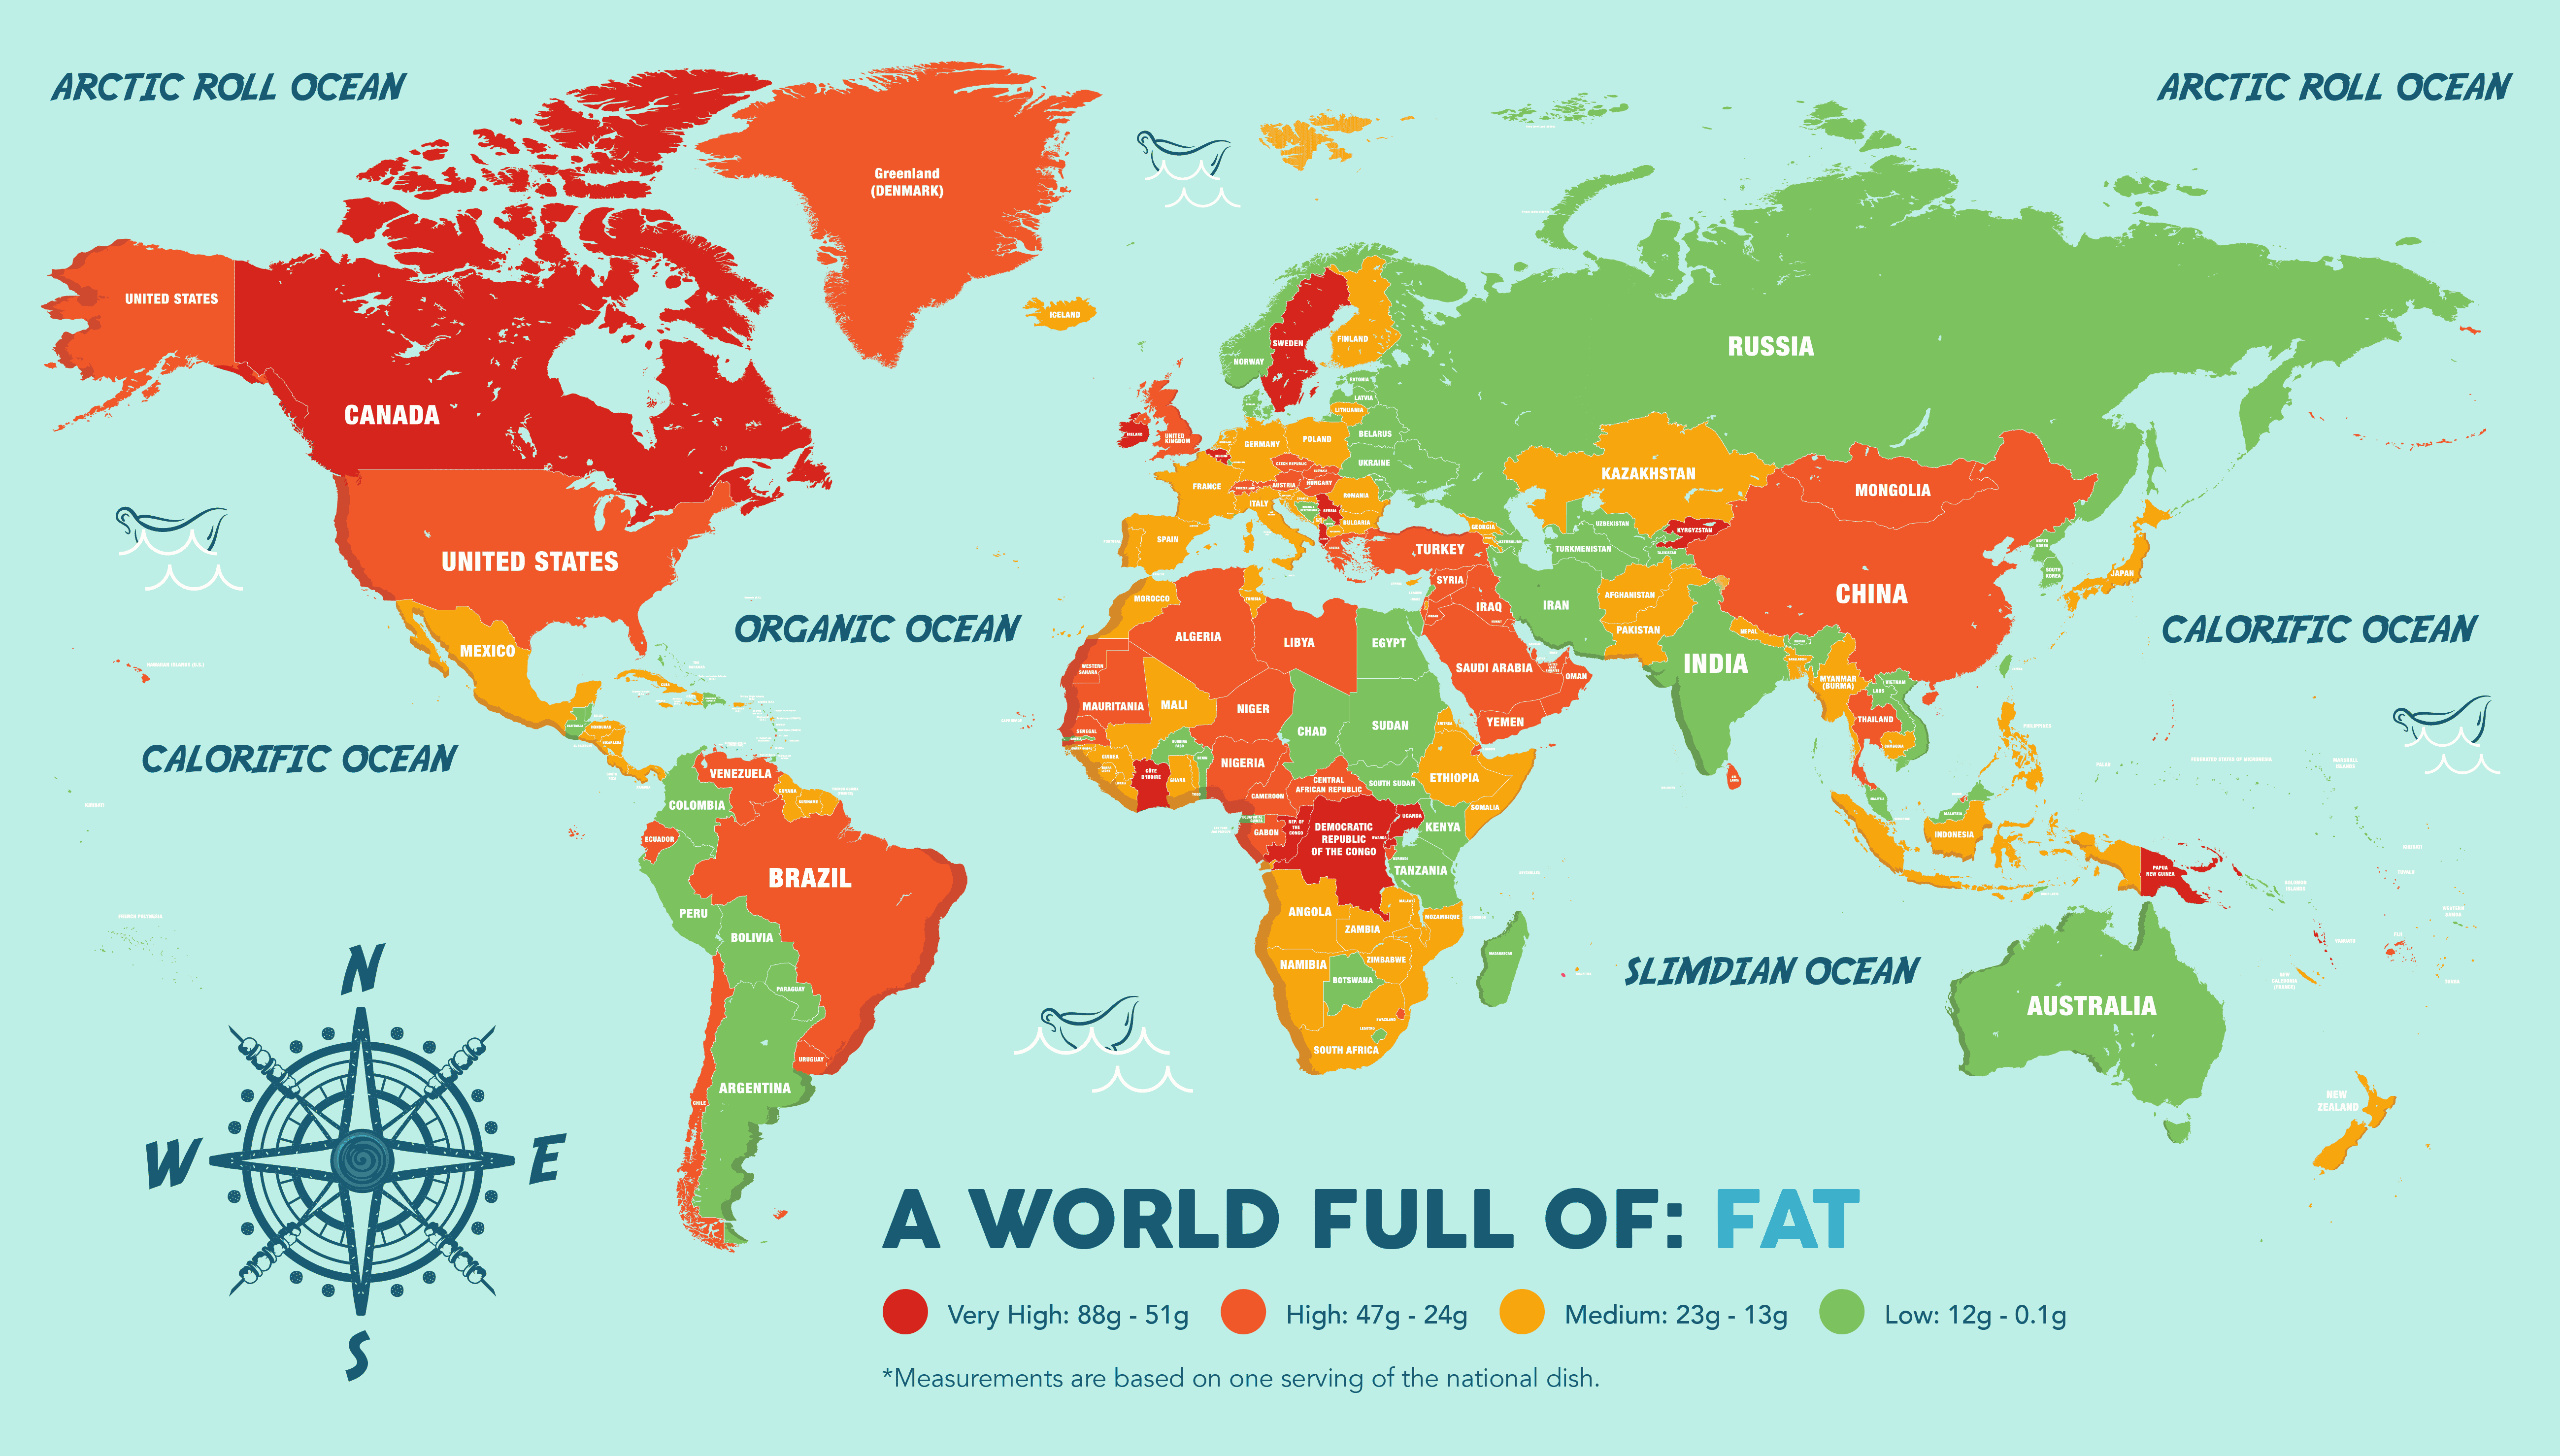
Fat
Mumu, a pork and roasted vegetable dish from Papa New Guinea has 88g of fat, making it the highest content in a national dish. As the maximum recommended intake is 70g a day, this is terrible for any healthy eating plan.
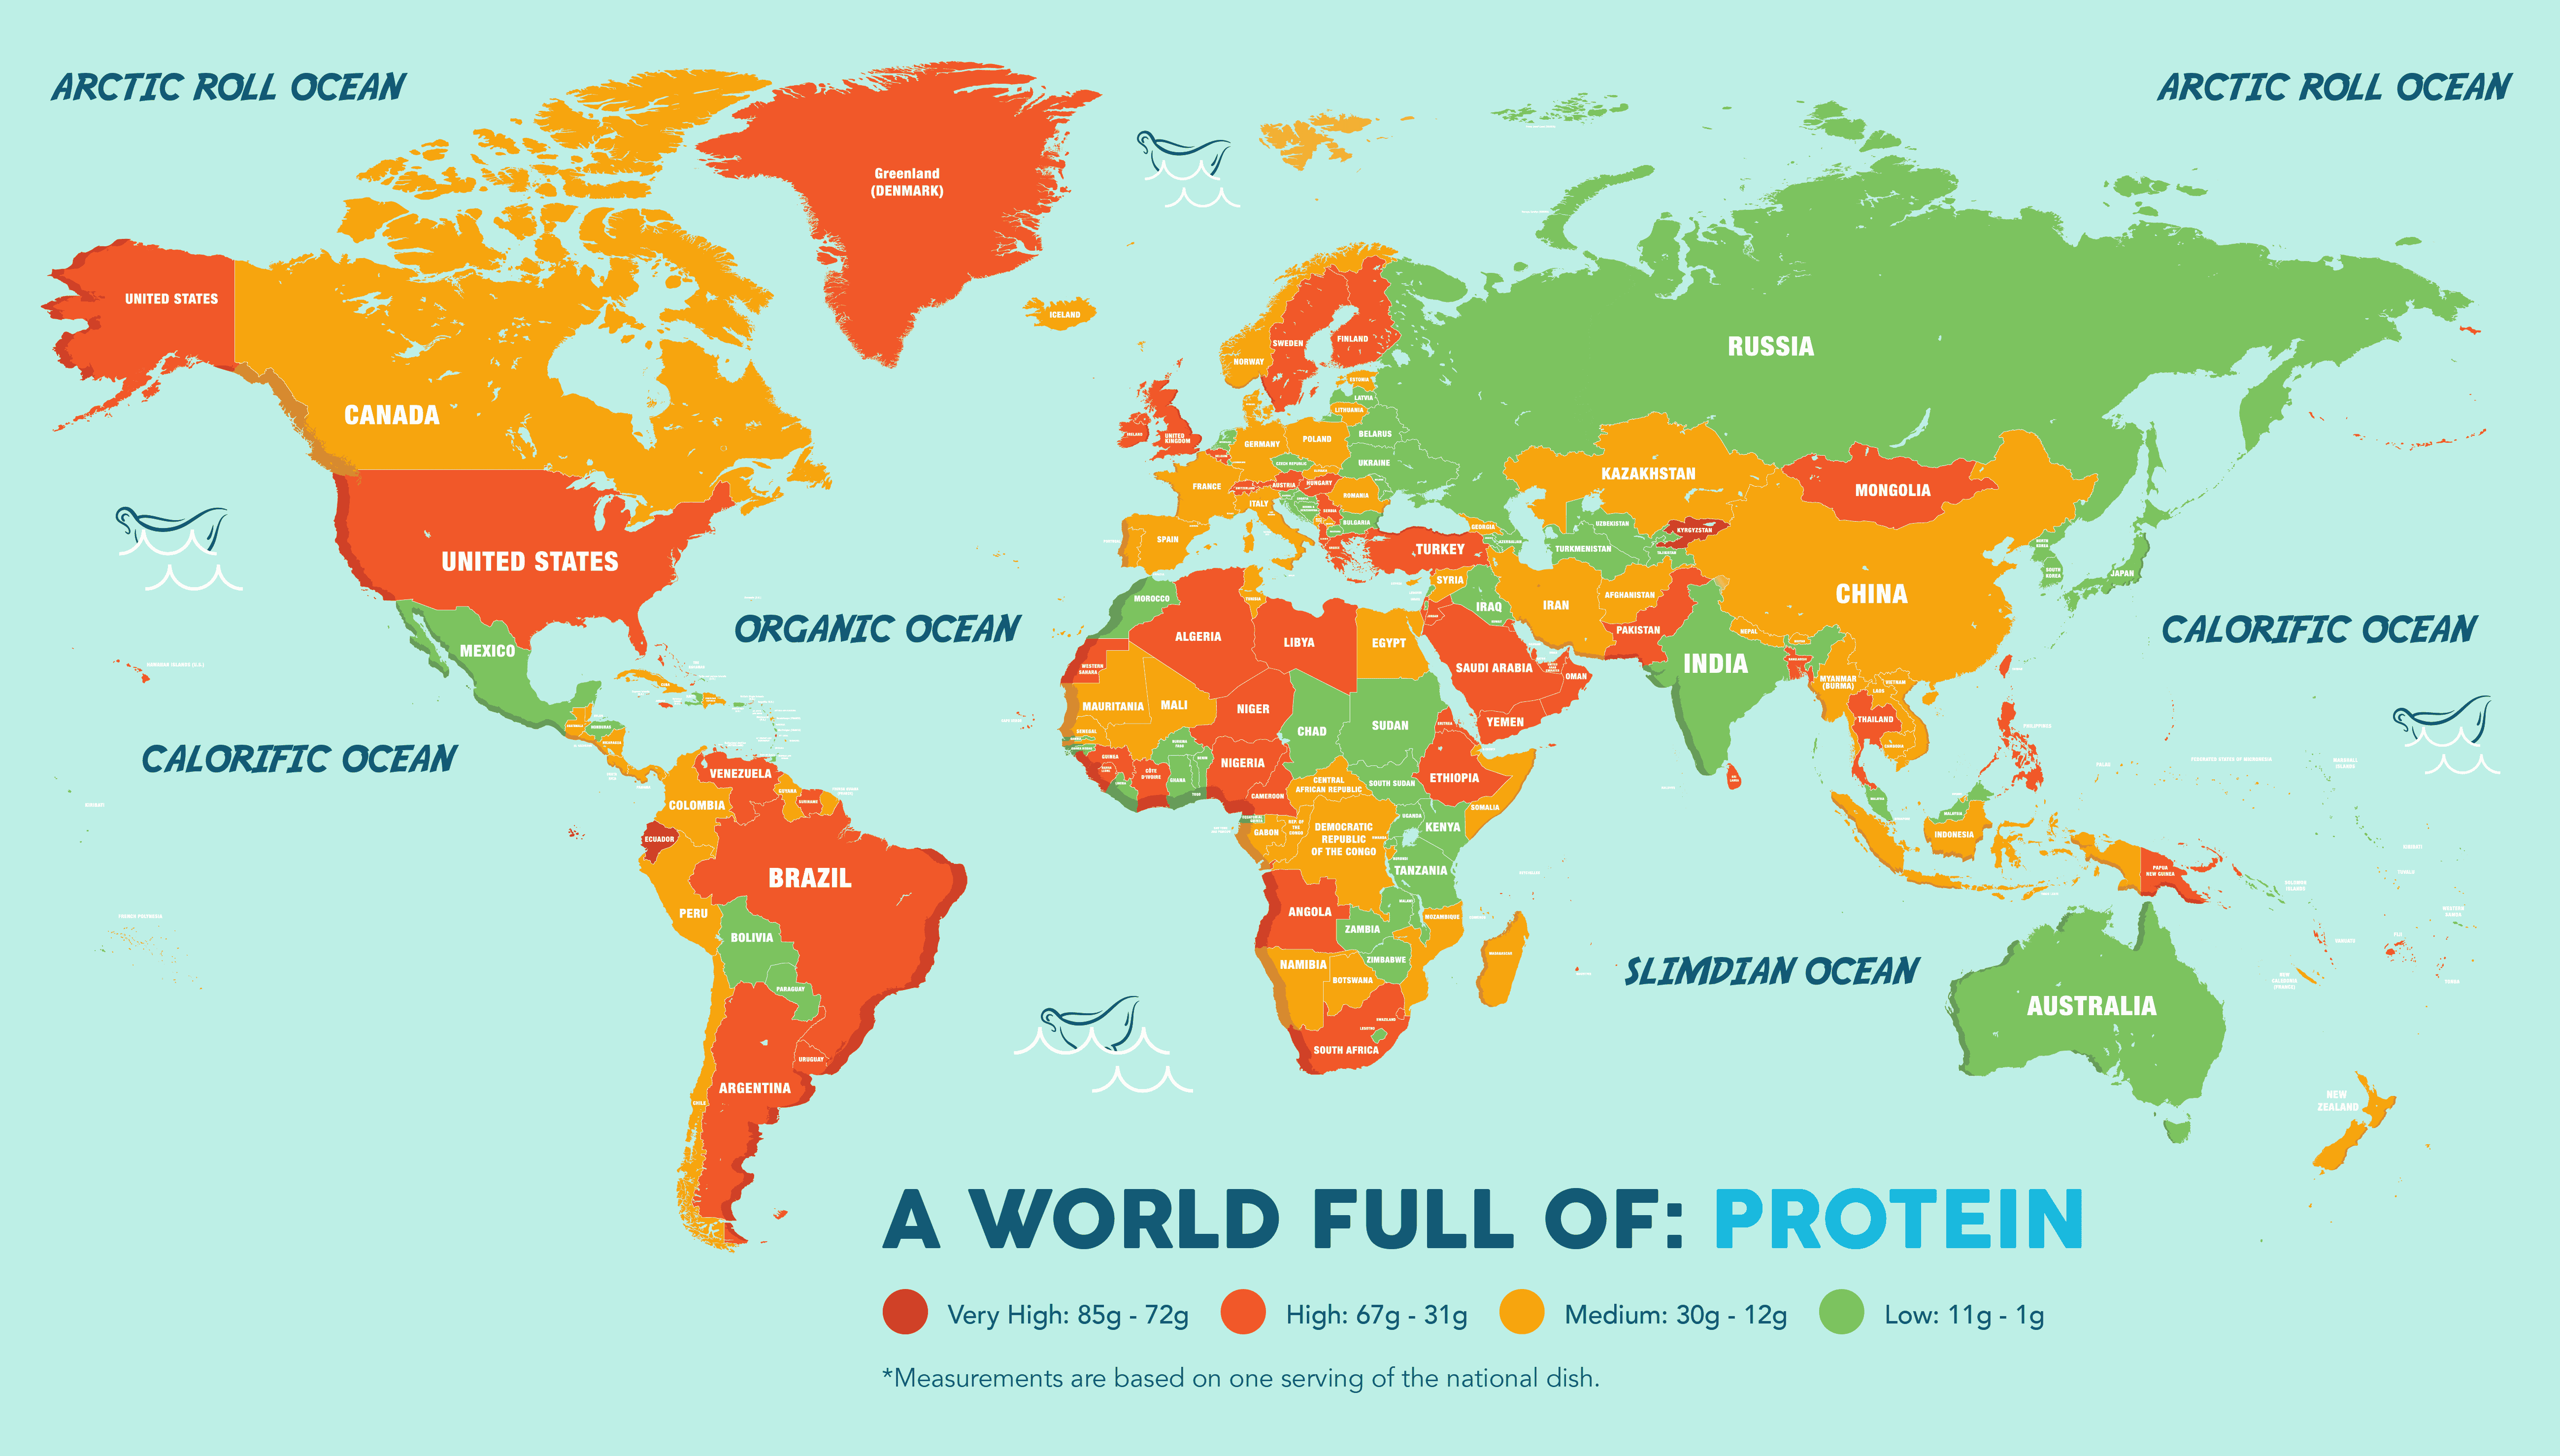
Protein
The last culprit is Singapore’s Chili Crab, with the highest amount of protein. At 85 grams of protein, this is 170% of your daily allowance of 50 grams.
What About Fish & Chips?
Obviously, our national dish in the UK is fish & chips, so where does this stand? You can probably guess that it is not the healthiest of meals, but let’s break it down:
- Calories – 688, so less than half of Langham and less than 50% of your daily allowance;
- Carbs – 71 grams, a fair amount of your minimum 260g a day;
- Salt – 3.59g, almost half of your daily allowance, but at least it’s not as much as Baeen;
- Sugar – 2g, pretty healthy on the sugar front at only about 5% of your daily allowance;
- Fat – 26g, which is about 37% of the daily recommended intake, so not too bad really;
- Protein – 43g, so pretty bad here as this is 86% of your daily intake.
If you are interested in even more lifestyle-related articles and information from us here at Bit Rebels, then we have a lot to choose from.
COMMENTS