This is a very interesting topic to me because there are so many factors that come into play when trying to measure the revenue generated from social media marketing. Social media is all about relationship building and networking, and it’s strange to me to think about assigning a dollar and cents value to it. I’ve read dozens of articles on this topic, and it’s really fascinating.
Here at Bit Rebels, we don’t sell anything that costs money to our readers; however, we still compare the value of Twitter and Facebook in terms of pageviews and traffic on our website. I had a conversation with Richard about this today. Our pageviews generated from Twitter are almost three times as much as pageviews from Facebook. However, don’t let this fool you. There are other factors to consider. First of all, we have 5,300 Facebook fans, and a combined 150,000 Twitter followers. It’s not really comparing apples to apples when we look at the overall numbers.
So, instead, let’s look at the individual click-through rates (CTR). When looking at those numbers, there really is no comparison. There is a waaaaaay higher return from Facebook. There is about an 80% higher chance someone on Facebook will click on a Bit Rebels link than someone on Twitter. Why is that? From a personal standpoint, I’ve noticed the same thing. If I ask the same question at the same time on Twitter to my 38,000 followers and on Facebook to my 800 friends, I will almost always have more of a response on Facebook. Does it simply go back again to the relationship building aspect of it all? Do we simply have more of a bond with people on Facebook?
And then we get into all the sticky details about long-term loyalty. What about those Twitter followers who have been following you for a year and love to RT your content every day? Is there a different value placed on that RT than someone who just started following you yesterday? Also, what about the bots? You can tweet a link on Twitter and instantly have 30 bots and spiders clicking on it. If you use bit.ly, you’ll get more accurate results since they exclude bot clicks from the click results they provide.
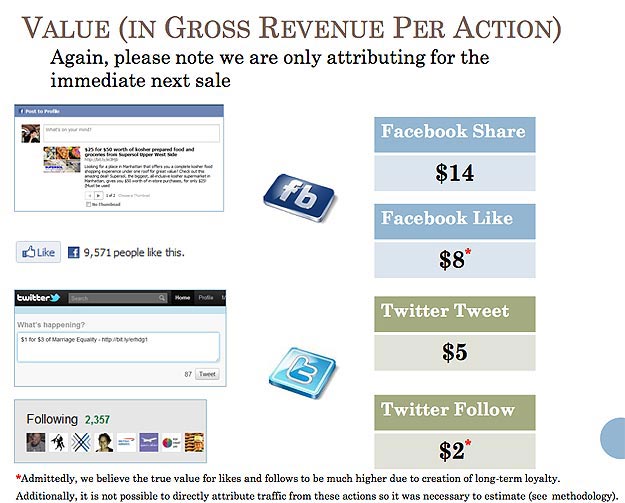
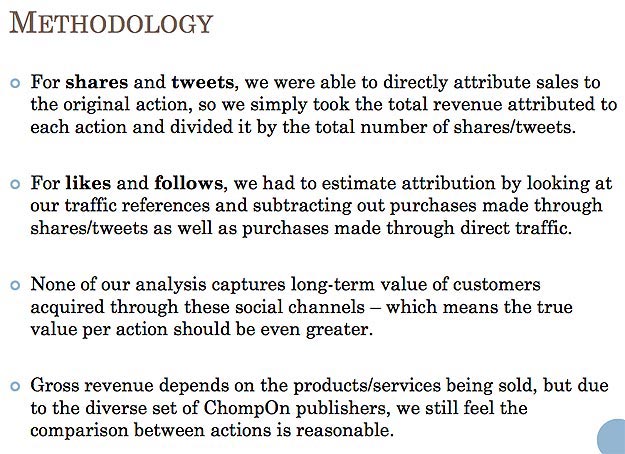
There is just so much ambiguity and ways to go with this. In my opinion, quality is much more important than quantity, and assigning an accurate dollar amount to this might be close to impossible. Social Media Today recently published an article on this same topic. They referenced a company called Chompon who recently did extensive research about this as it relates to their own business. Their findings were absolutely fascinating, and I encourage you to download the PDF of their results. I put a screenshot of some of their results and methodology below for you to check out.
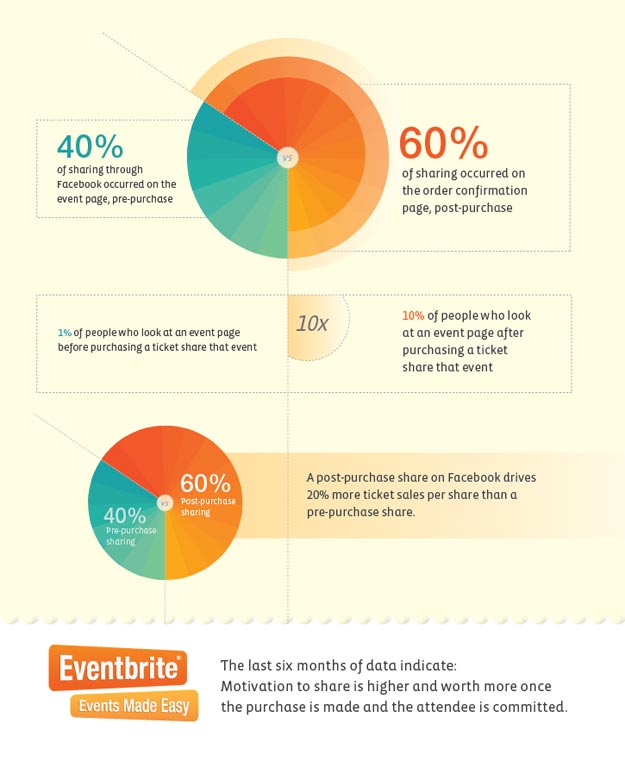
Eventbrite also did their own research on this topic in October of 2010. They found that their revenue (in ticket sales) come mostly from Facebook ($2.52), followed by LinkedIn (90 cents) and lastly from Twitter (43 cents).
I found three more very interesting articles on this topic. Two of them are on Fast Company. One is Twitter Crushing Facebook’s Click-Through Rate and the other is Fast Company’s view about the Eventbrite study. It is called Facebook Is Worth $2.52, Twitter Only 43 Cents. Brian Solis also wrote a great article on this called ROI: How To Measure Return on Investment in Social Media. Have you ever done any research on this topic yourself? What have you found? I would be very interested to read your take on it.


COMMENTS