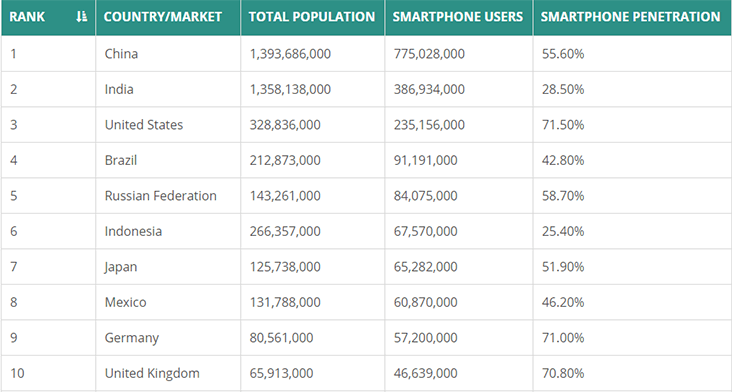
A recent study focused on the global level of mobile phone penetration has yielded many interesting statistics and facts. According to BankMyCell’s latest report, there are now more mobile devices than there are people, by a factor of almost 1 billion. Utilizing data from GSMA, (real-time data), it is now known that there are in excess of 8.6B connections for mobile devices across the world.
By comparison, according to the most recent estimates provided by the United Nations, there are 7.63B people currently living on planet Earth. Accounting for multiple devices and the like, it is estimated that approximately 66.65% of all citizens are mobile device users. Smartphone adoption rates among senior citizens will likely spur a greater market share migrating away from cellular devices to smartphone models.
Top Markets For Further Penetration
It is likely no surprise that China leads the penetration table in terms of most users at 775MM. Of interest is that this represents only about one half of their population. This data is extremely pivotal to firms that are looking to increase their market presence and penetration in the country.
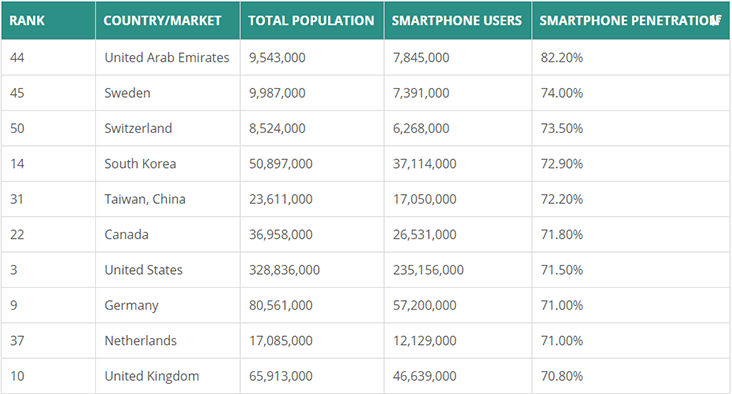
At the other end of the usage spectrum is the United Arab Emirates, with 7.845MM of unique users which represents a hefty 82.2% of smartphone ownership amongst its citizens. Surprisingly, it is Bangladesh where only 5.40% of the population owning smartphones.
The Influence Of Apple And Samsung In Adoption And Penetration Rates
Both companies have had a significant impact on penetration and adoption rates, with the two manufacturers spurring the overall industry forward at an impressive rate. As more and more consumers move to smartphone devices, these two manufacturers gain more market shares. In the United States alone, the two have ownership of 79.22% of the entire market and 71.5% of all American consumers who use a mobile device have a smartphone. As the rate of adoption continues, it is predicted that by the conclusion of 2018, smartphones are expected to outpace cellular phone ownership, with their ownership share surpassing 50%.
A Closer Look At The United States Market For Smartphones
The global statistics referenced above give valuable insight into the correlation between the affluence of a country and the adoption rate of smartphone penetration and adoption. Let’s take a closer look at the demographics of the United States and how they affect adoption rates as well as the market share of different manufacturers. It is clear that many American consumers are now completely wedded to the digital age and there are many who have crossed the line over to addictive relationships with their mobile devices.
Gender, Geographic Location, And Ethnicity
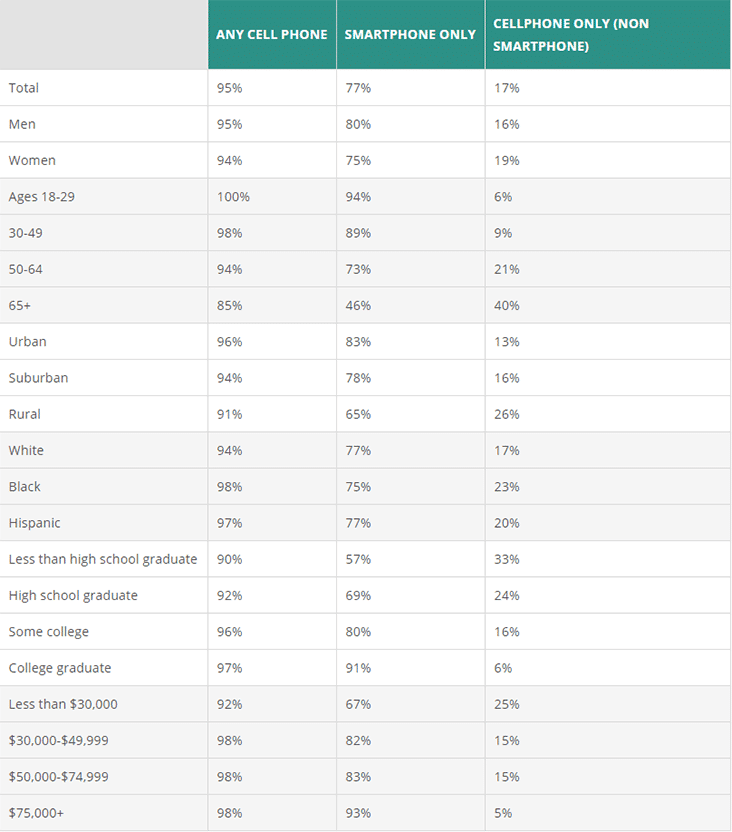
Of interest, is the fact that adoption of smartphone use and ownership crosses lines between gender, geographic location, and ethnicity in a way that is unique to this product. Consumer research firm Newzoo predicted that in the 2015-2020 timeframe that smartphone ownership in the U.S. would equal 71.5%. However, this data survey, conducted in 2018, reveals that the current smartphone penetration level in the country is 77%.
Income Level, Age, And Education Level
While gender, geographic location, and ethnicity do not appear to account for much variance in ownership rates, there are several data points where differences are noted. When age, education, and income level are considered, more significant variances emerge. Looking at age shows that 94% of American consumers aged 18-29 own a smartphone. By comparison, the ownership rate for the 65 and older cohort is only 46%.
Affluence is another marker, with 67% of consumers whose annual income is $30,000 or less owning a smartphone and only 57% of citizens without a high school diploma reporting ownership. This is compared with the 77% adoption rate for the country overall.
Top Six Manufacturers In The U.S. Marketplace
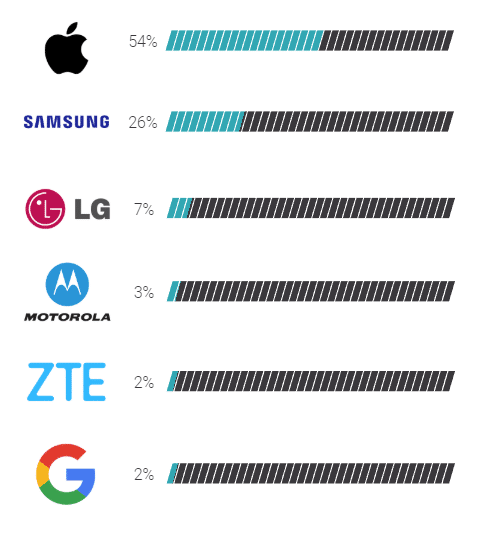
According to the Global Mobile Market Report, Apple and Samsung hold the bulk of the U.S. market share with the two manufacturers comprising nearly 80% of the entire product share of smartphone ownership. Data collected from June 2017 through June 2018 shows that Apple holds 53.65% of the market share and Samsung has a 25.57% level. The top six is rounded out by LG, Motorola, ZTE, and Google.
The tech resource CNET states that there are 250MM machine to machine connections which supports the GSMA figure of 8.6B mobile connections and the higher amount of machines over humans. The continued study of mobile smartphone adoption rates and the number of devices that each person owns will surely continue to reveal fascinating information. Understanding adoption rates across demographic and geographic location markers will surely give market watchers even more actionable information to inform their future marketing campaigns.
If you are interested in even more technology-related articles and information from us here at Bit Rebels then we have a lot to choose from. – Source: BankMyCell


COMMENTS